2.4.8.11. Host View
The Host View shows a summary of the host’s general information and provides a chart of the resources (CPU and memory).
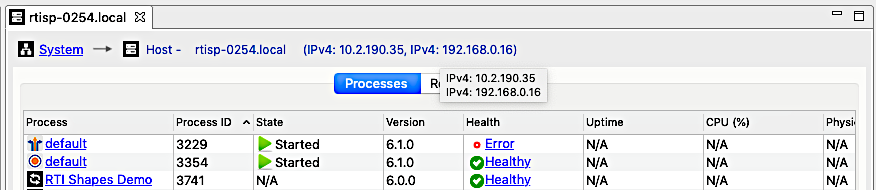
2.4.8.11.1. IP Info
All the currently in-use IP addresses associated with a host are listed. Hover on the text to see the full text in a tooltip (if some are not visible).
2.4.8.11.2. Processes Tab
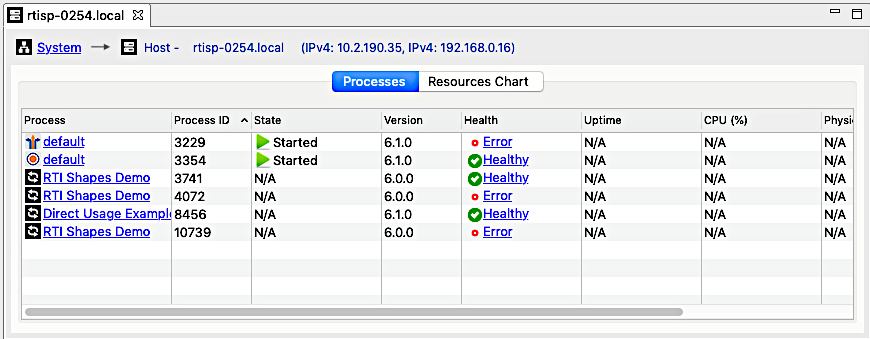
Process - Displays the name of the process represented by this row and which is running on this host. Clicking on this cell will bring up an editor for this process.
Process ID - The process id.
State - The state of the RTI service. Note that this information can only be displayed for RTI services.
Version - The version of Connext being used by the process.
Health - The health state of the process.
Uptime - The total time the process has been running. Note that this information is only currently supported by the RTI Routing Service.
CPU (%) - Current CPU usage by the process. Note that this information is only currently supported by the RTI Routing Service.
Physical Memory - Current physical memory consumption by the process. Note that this information is only currently supported by the RTI Routing Service.
Total Memory - Current total memory consumption by the process. Note that this information is only currently supported by the RTI Routing Service.
2.4.8.11.2.1. Resources Chart Tab
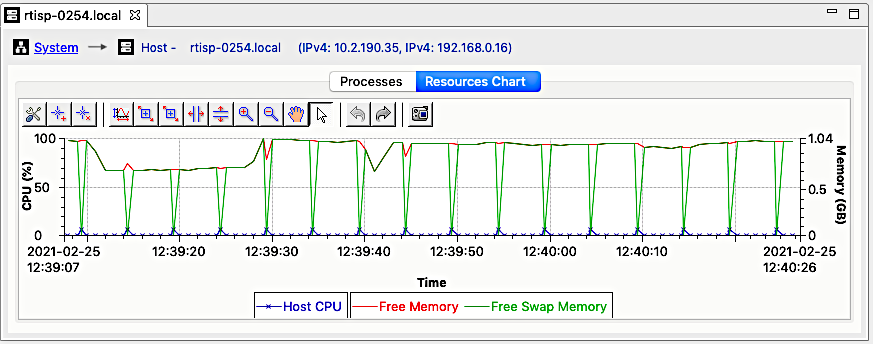
This tab contains a chart that shows the host CPU, free memory, and free swap memory resources.
The chart’s toolbar has many useful features, including the ability to save the chart as a raster graphic to disk.
Note
The information in this chart can only be populated if an instance of Routing Service is running on the host and the monitoring capability is enabled.