2.4.8.9. Topic View
The Topic View is a user interface focused on information about a single DDS Topic. It has four tabs: Match Graph, Topic Data, Endpoints Table, and Datatypes.
2.4.8.9.1. Match Graph Tab
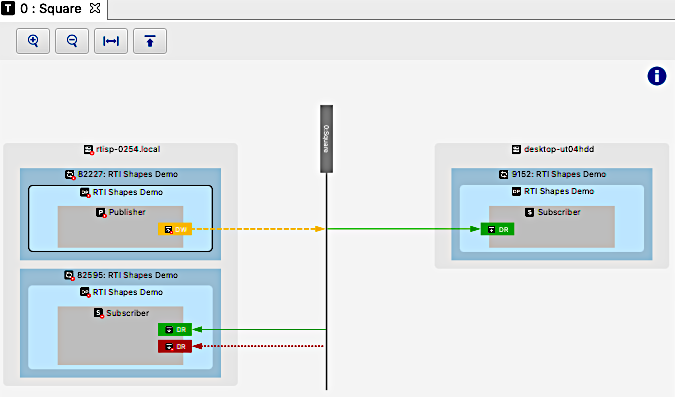
The Match Graph is a graphical view that shows all the information related to a specific topic. Its main purpose is to convey the match status of the DataWriters and DataReaders associated with the topic in a simple, easy to digest format.
The graph is organized so that the central node will be the topic node, that is the one driving the visualization of the graph. This is the thin, long node that appears surrounded by, and connected yo, the different entities that has been discovered and are related to the topic.
The surrounding elements consist of the Hosts, Processes, DomainParticipants, Publishers, Subscribers, DataWriters, and DataReaders - organized in a hierarchical structure to make it easy to understand the underlying DDS System. Only the entities that are relevant for the topic being visualized in the graph are shown.
Note
For information on how the Publishers and Subscriber are named, please see the section Publishers and Subscribers names
For example, the following image shows a view with only one element of each specific kind of entity that can be shown in the Match Analysis topic view:
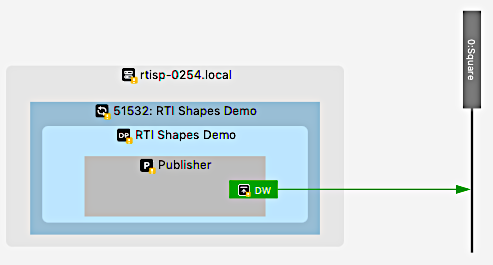
In this example, we have a topic Square running in Domain 0. One host called rtisp-0254.local is running one process, with ID: 51532, called RTI Shapes Demo. This process created one DomainParticipant, called RTI Shapes Demo. That DomainParticipant created one Publisher with one DataWriter that writes its samples to the topic Square.
You can interact with this graph in different ways:
Move the mouse over an entity: When no other item has been selected, this interaction will update the graph to show the match analysis status for that entity.
That entity will be the one that drives the match analysis. The state for the rest of entities will be updated based on that analysis. This interaction will also update the Entity Info tab in the lateral panel of the graph, to display relevant information about that specific entity.
Select an entity: Selecting an entity will fix the match analysis to use that selected entity, disabling the mouse-over interaction until the selection is removed (for example, by clicking on an empty space of the graph). This interaction will also update the rest of views apart of the graph, such as the QoS View.
Double-click: Double-clicking on a specific entity will cause an entity-specific view to open (if that type of entity has a specific view). For example, there are entity-specific views for the DDS Data Type, DDS QoS, and Match Analyses.
When performing the match analysis, the different endpoints (DataWriters and DataReaders) can be in five different states, according to the match analysis state and the interaction with the graph performed by the user. Table 2.2 shows the possible states and meaning for each state.
Example Icon |
State |
Description |
|---|---|---|
|
Matched |
The endpoint matches with all the opposing DataWriters/DataReaders |
|
Partially matched |
The current endpoint has a match with at least one, and a mismatch with at least one, of the opposing DataWriters/DataReaders |
|
Not matched |
The endpoint does not match any other DataWriters/DataReaders |
|
Selected |
The current endpoint has been selected to drive the match analysis |
|
Not relevant |
The endpoint is not relevant for the match analysis |


Note
When one endpoint is selected, the match analysis status for the rest of entities will be updated to consider only this endpoint when providing the matching status.
Note
An endpoint will not be relevant for match analysis if it is not directly connected with the selected entity. For example, a DataWriter will not be relevant for other DataWriters to perform the match analysis.
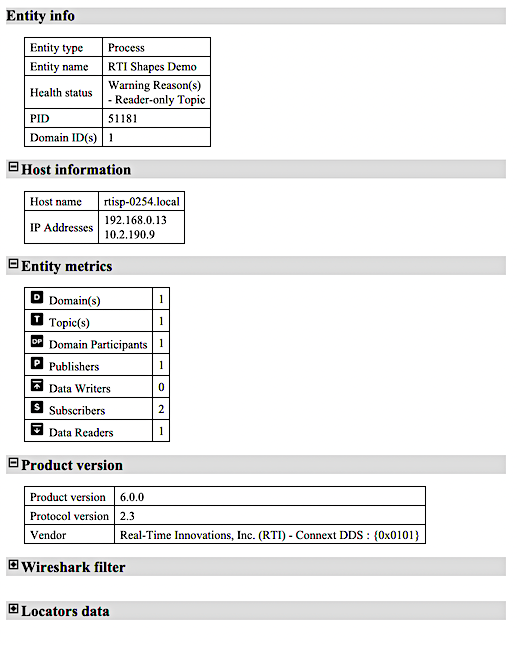
This view also provides specific information about the entity that has been selected to drive the match analysis. This information will be located at the right of the graph and will be updated according to the kind of entity that was selected. It will show information such as the name of the entity, metrics about child entities, parent host information, product version, or Wireshark filters that can limit the displayed information to only that entity. The following image shows an example of what information can be seen in this panel:
2.4.8.9.1.1. Topic Data
You can use the Topic Data tab to subscribe to, and visualize data from, the DDS system. See the section Data Visualization for help.
2.4.8.9.1.2. Endpoints Table
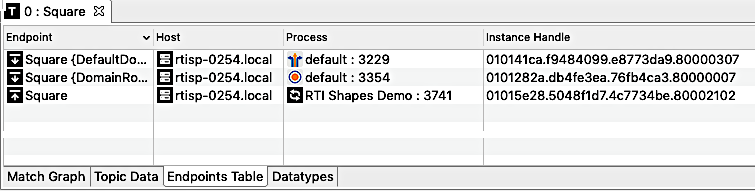
The Endpoints Table details the DataReaders  and DataWriters
 associated with a single DDS Topic. Each endpoint is displayed
in a single row, along with the host and process that contain it. The Instance
Handle is also displayed; which can be useful as it relates to locating exactly
which DataWriter wrote a particular sample (such as when inspecting data from a
sample with the Sample Inspector).
associated with a single DDS Topic. Each endpoint is displayed
in a single row, along with the host and process that contain it. The Instance
Handle is also displayed; which can be useful as it relates to locating exactly
which DataWriter wrote a particular sample (such as when inspecting data from a
sample with the Sample Inspector).
2.4.8.9.1.3. Datatypes
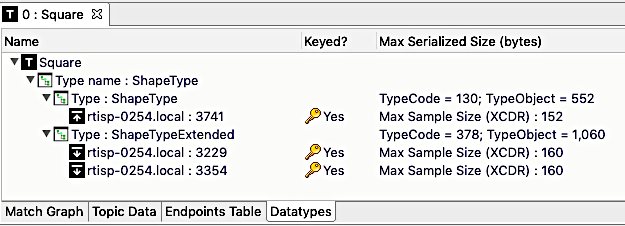
This tab display a hierarchical view of the data types and endpoints
associated with this topic. The tree begins at the top with the topic
 itself. Below that are type name nodes
  .
These nodes simply represent name of the type as it was registered with the
DDS API.
.
These nodes simply represent name of the type as it was registered with the
DDS API.
Below the type name nodes are data type nodes (they currently
use the same icon). These nodes will trigger the DDS Data Type view to
display their type information. Below the type nodes are DataReaders
and DataWriters which use that data type.
The Keyed? column indicates if the type shown in that row is keyed or not.
The Max Serialized Size column shows the maximum size, in bytes, required to serialize the associated object.
The Datatypes view is most useful when trying to debug the types used in a distributed system. In a large system, it’s often hard to keep track of who is using which type, so this view provides a convenient way to discover the types in use and see if there are match problems, perhaps due to conflicting types.