2.3. Features Overview
Admin Console provides a centralized tool for monitoring, debugging, and administering your distributed system. This section provides an overview of the key features available in Admin Console.
2.3.1. Match Analysis
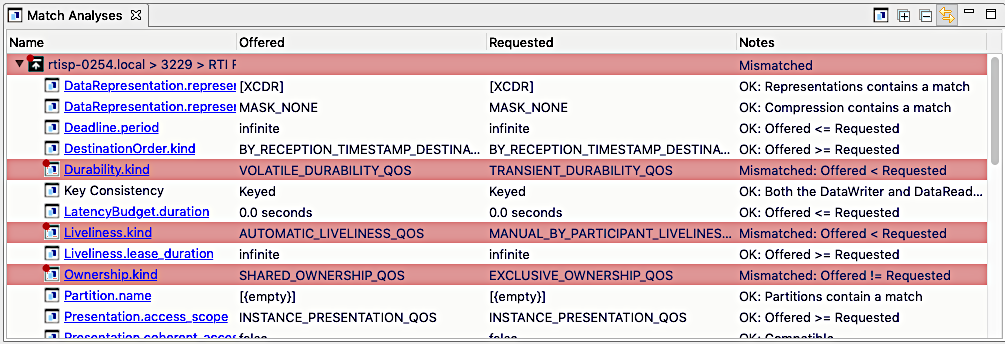
Admin Console proactively checks to ensure that your distributed system’s Quality of Service (QoS) settings are compatible. This analysis happens automatically and in real-time. As QoS changes occur in your system, Admin Console is notified and updates the analysis to reflect the most recent settings.
Relevant reference topics:
2.3.2. System Overview
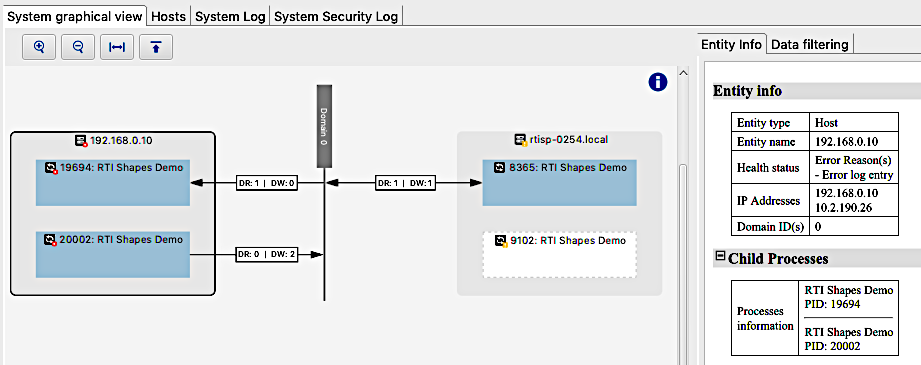
Admin Console collects information about the entities that have been discovered in the system, how those entities are connected, and relevant information such as entity counts. It summarizes this information in an easy-to-read set of views. You will see the entities that were discovered and how those entities are connected, providing information about the underlying DDS system. The views also provide information such as the number of entities that are participating in your distributed system, auxiliary information such as Wireshark® filters to facilitate package filtering in Wireshark, product and protocol versions that are running, and Locators data for the entities. This information can be used to compare how the system is running in the current execution against previous executions, or detect design issues such as DataWriters or DataReaders that are not matching or are connected to the wrong Topics or Domains.
Relevant reference topics:
2.3.3. Service Administration
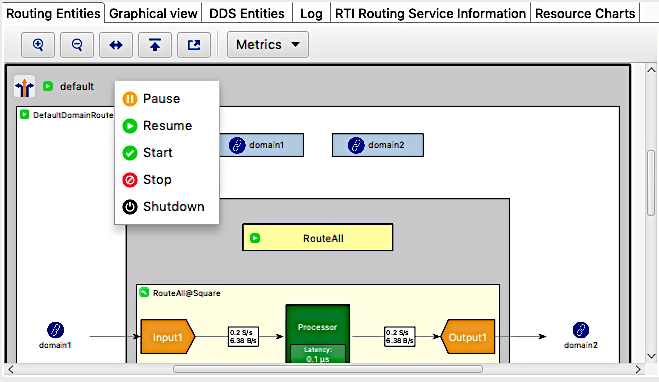
You can use Admin Console to remotely administer RTI services (for those services that support remote administration). You can remotely perform actions like enable, disable, pause, or resume a service or its components. Some services can also be shutdown remotely.
Relevant reference topics:
2.3.4. Performance Monitoring
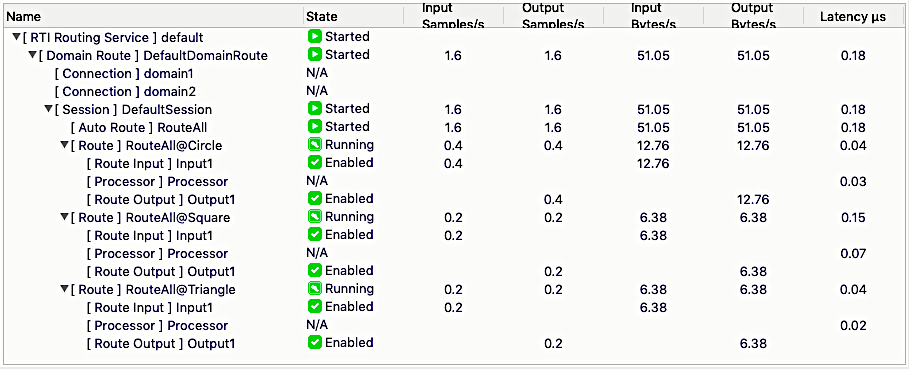
For RTI services that provide detailed performance statistics, such as Routing Service, Admin Console will display information such as data throughput and latency for each route.
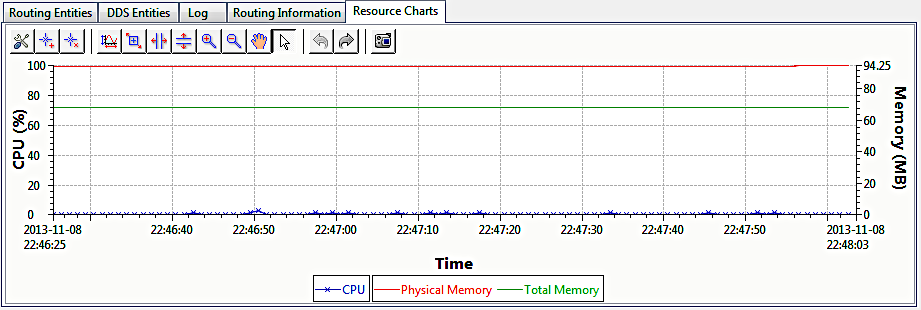
Routing Service also provides resource-consumption data. Admin Console displays this information in a chart.
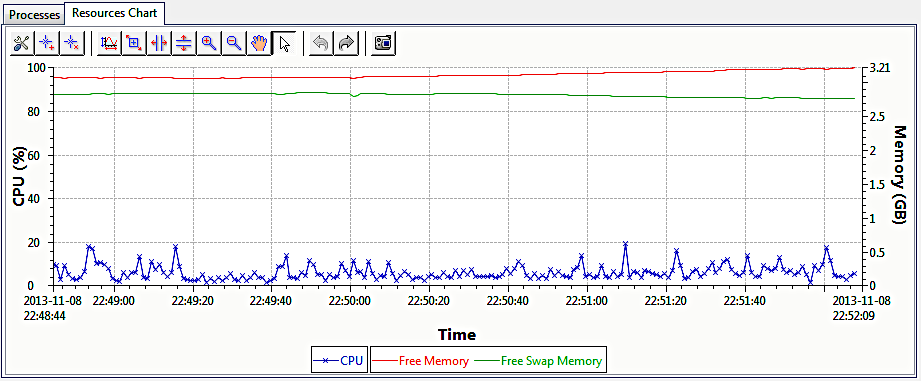
Routing Service also provides resource-consumption data for the host that it runs on. Admin Console displays this information in a chart.
Relevant reference topics:
2.3.5. Distributed Logging Display
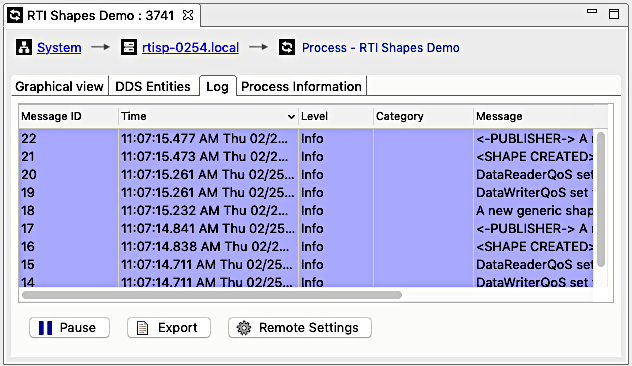
Log messages contain crucial information for each component in the distributed system. Admin Console provides a Distributed Log view to display log messages from any RTI services or processes that use RTI Distributed Logger. You can also customize the verbosity of the log messages through the Log.
Relevant reference topics:
Proces view distributed logger Log
2.3.6. Discovery Data Export/Import


DDS discovery information can be exported from Admin Console into an XML file. The exported data can then be imported and displayed. This feature could be used to collaborate with project team members or with RTI support.
Relevant reference topics:
2.3.7. Retrieving & Editing Service Configuration
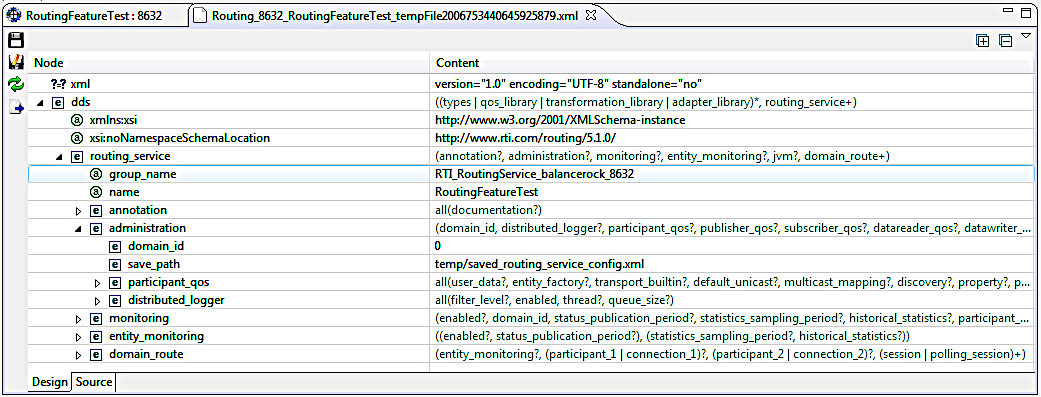
For supported RTI services (Routing Service versions pre-6.0.0), Admin Console can retrieve and edit the current configuration remotely at runtime.
Relevant reference topics:
Routing service Configuration View
2.3.8. Customizable View Layout
Admin Console uses the Eclipse® Framework and provides very customizable layouts for all the views. You can easily rearrange the views by opening and closing views as needed, and dragging and docking tabs to various windows. You can also easily maximize a particular tab by simply double-clicking on it.