2.2.4. Step 4: Routing Service
In this step, we will look at the Routing Service interface. Click on the Routing Service node in the Physical View or in the Processes View. The first tab, Routing Entities, contains four sub-views: a hierarchical (tree), configuration, a statistics view, and a graph depicting the service. We will also look at the Resource Charts tab.
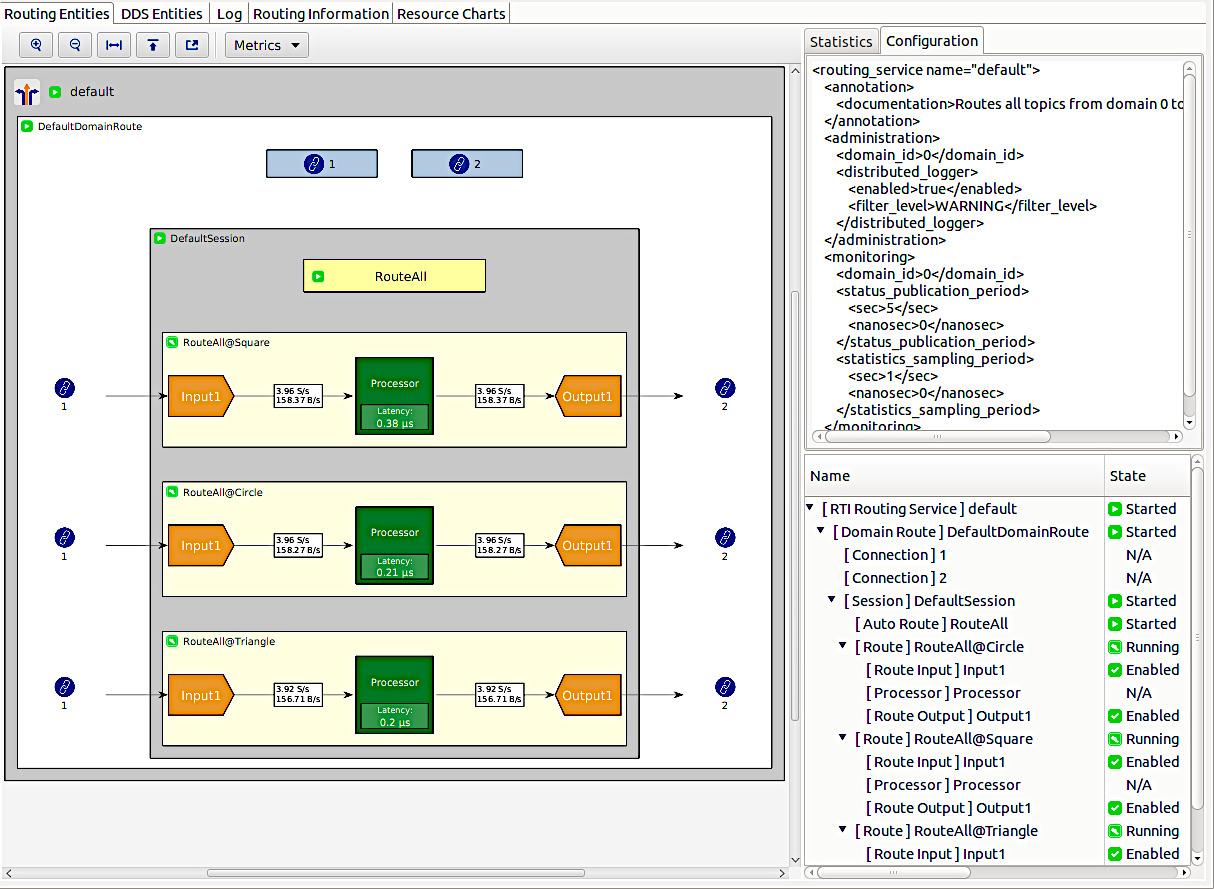
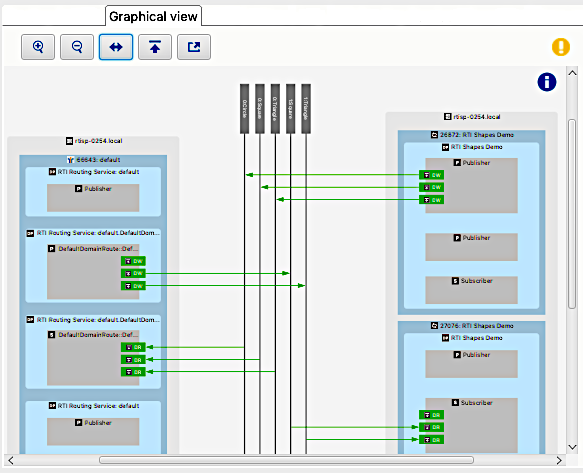
2.2.4.1. Routing Service Graph View
The graph view shows Routing Service’s internal entities. It is interactive: you can click on each entity, causing the statistics and configuration views to update their displays with information corresponding to that entity. Right-clicking an entity displays a menu of commands that can be sent to the service.
Right-click on DefaultDomainRoute and choose the pause menu item. Note that the Routes contained within that Domain Route change their states from running to paused. You can also see the change in Shapes Demo: the shapes should have stopped moving.
Right-click on DefaultDomainRoute and choose resume. The Routes should go back to running, and Shapes Demo should receive data again. Note also that the throughput (samples per second and bytes per second) now shows non-zero results.
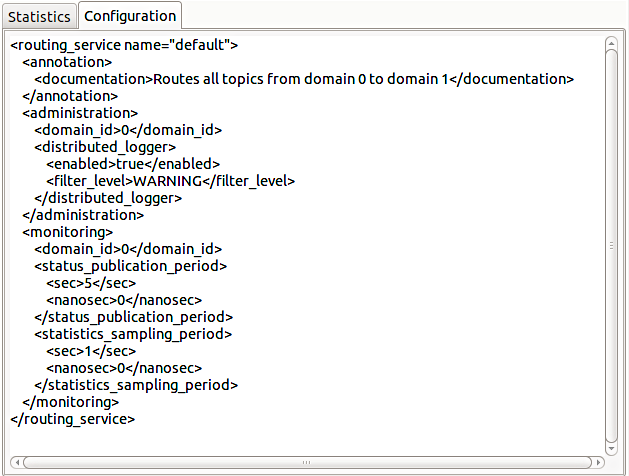
2.2.4.2. Configuration View
The configuration view displays configuration data for the selected service entity. Note that the XML displayed may not exactly match the original configuration file’s content. Also please note that the configuration is shown only for the selected entity and does not include sub-entities. This means, for example, that you cannot simply copy the service configuration XML to a file and use it directly.
Click on default in the graph or tree views to see the service’s top-level configuration.
2.2.4.3. Hierarchical (tree) View
This view contains several columns, which display the state, throughput, and latency data for the service. This view can also be used to select entities (which cross-highlight in the graph view) to inspect their configuration or statistics.
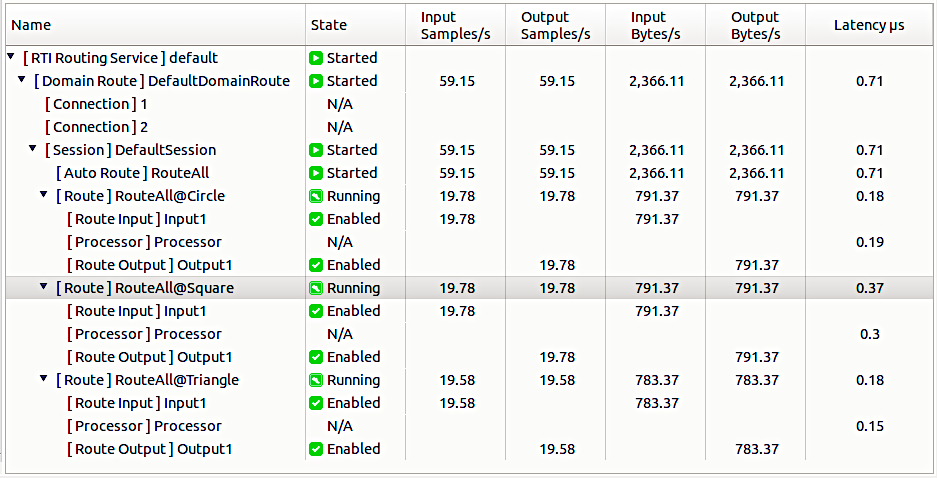
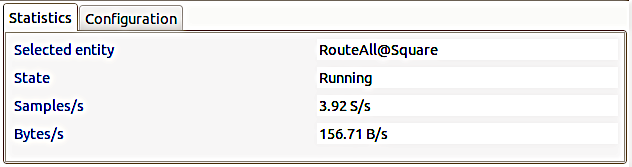
2.2.4.4. Statistics view
The statistics view displays state and performance data for the selected service entity. It overlaps with the information shown in the tree view but is primarily intended to be used with the graph.
2.2.4.5. Graphical View
The Graphical View tab allows you to visualize the Process View graph related to the Routing Service process, as explained in the Tutorial Step 3: System Visualization.
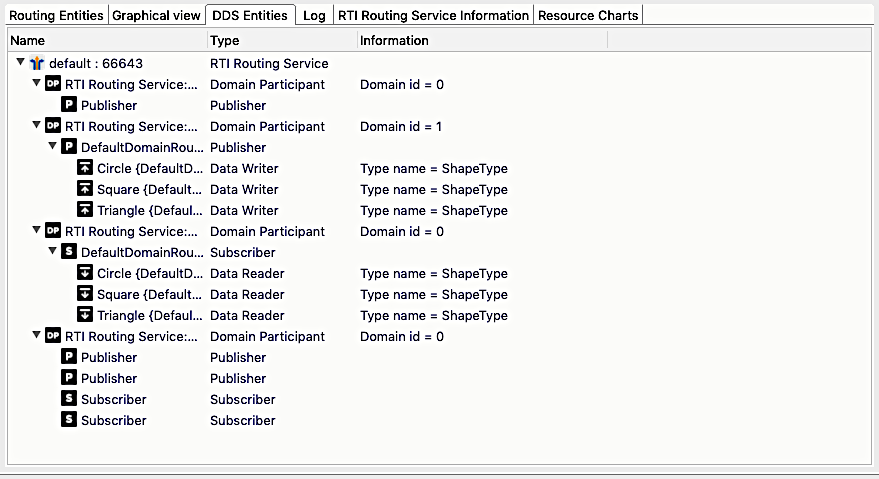
2.2.4.6. DDS Entities
The DDS Entities tab will display information about all the entities that were created by the Routing Service process.
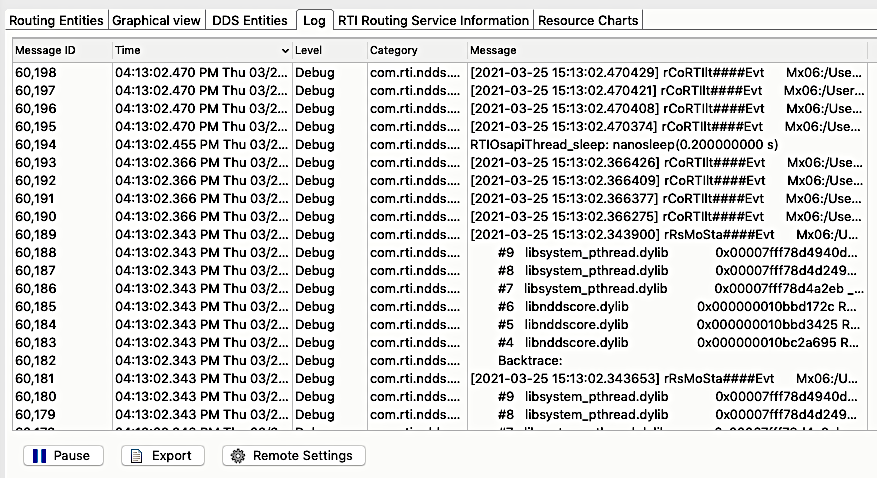
2.2.4.7. Log
The Log tab will provide the log messages that were received through the Distributed Logger by the Routing Service process.
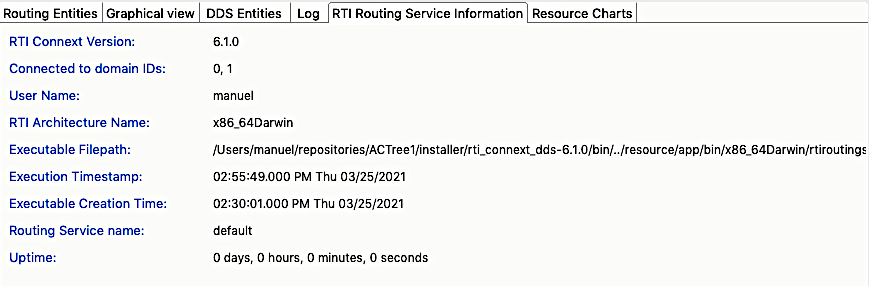
2.2.4.8. RTI Routing Service Information
The RTI Routing Service information tab provides specific information about the Routing Service Process.
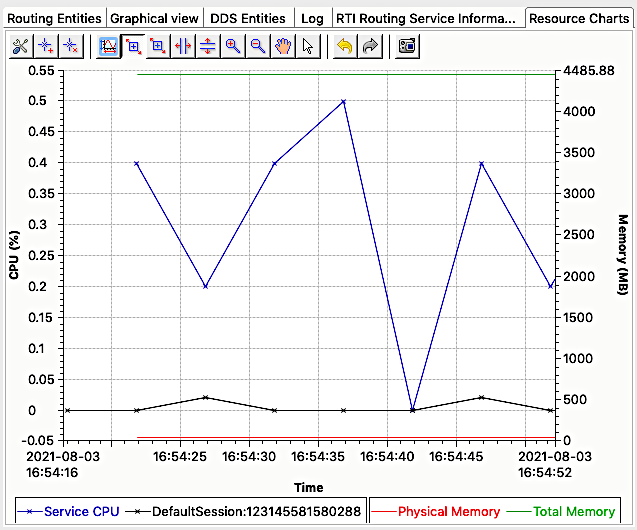
2.2.4.9. Resource Charts Tab
The Resource Charts tab contains a chart showing the CPU and memory consumption of the service over time.