2.2.7. Step 7: Distributed Debugging with the Topic View
Admin Console provides insight and details about your distributed system that can be used for debugging. In this step, you will see how to use these view to debug your system.
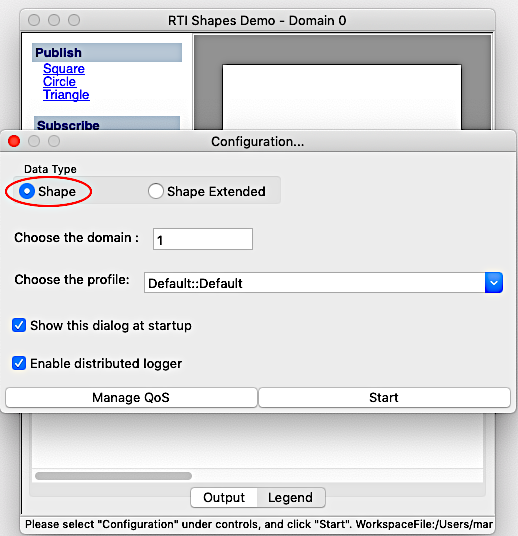
The Topic View provides three distinct sets of information related to a single DDS Topic in the distributed system. To best understand this information, let’s first create a new instance of Shapes Demo. Follow the same directions as in Step 1, but this time choose the “Shape” data type rather than “Shape Extended”.
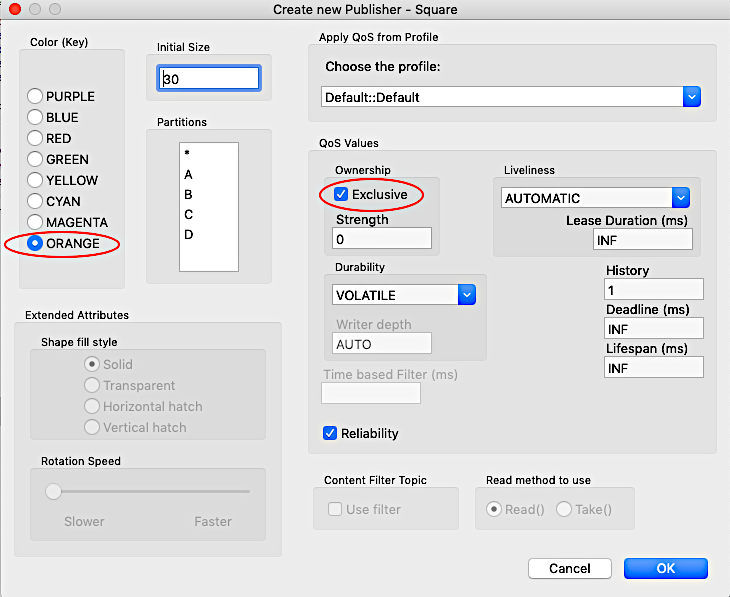
This time, let’s create an orange Square with exclusive ownership.
From the DDS Logical View, select the “Square” Topic under “Domain 1” The Topic View is now displaying the Endpoints Table.
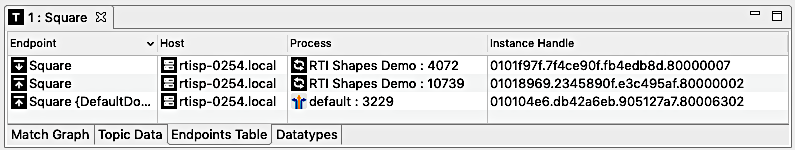
All of the DataWriters and DataReaders associated with this topic can now be seen in the the Endpoints Table tab. This table shows the host and process to which the endpoint belongs. These two facts alone are often very helpful in understanding what is running where. When you select rows from this table, you will get detailed information about the data type, QoS, and match status of the endpoint.
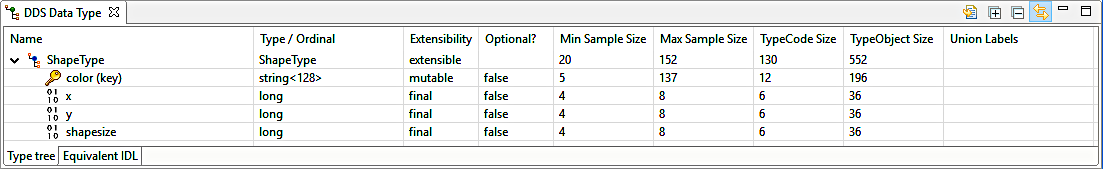
Select the DataWriter associated with the Shapes Demo (use the icon
 in the Endpoint column and the process name from the Process column
to find it). Now you can see the datatype associated with this DataWriter in
the DDS Data Type View.
in the Endpoint column and the process name from the Process column
to find it). Now you can see the datatype associated with this DataWriter in
the DDS Data Type View.
Select the DataReader associated with the Shapes Demo created earlier. Notice that the DDS Data Type view changes and now has this content:
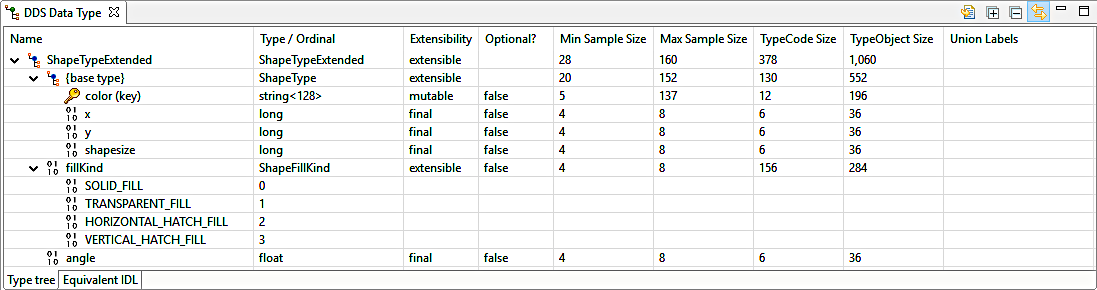
The following shows that the system has multiple type-definitions for the same Topic. This is often a critical piece of information, so much so that another tab in this editor is dedicated to making this information easy to find. Select the “Datatypes” tab from the bottom right of the Topic View:
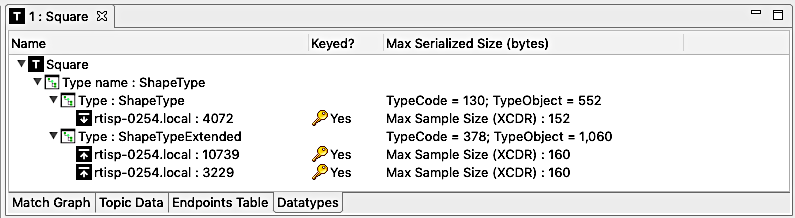
This tab shows which endpoint is associated with each of the two datatypes currently being used in the system for this Topic. It also shows the serialized TypeCode and sample size for each of the two datatypes. This information is important when tuning DDS QoS. Select the DataWriter listed under the “ShapeType” datatype. Now click on the DDS QoS View:
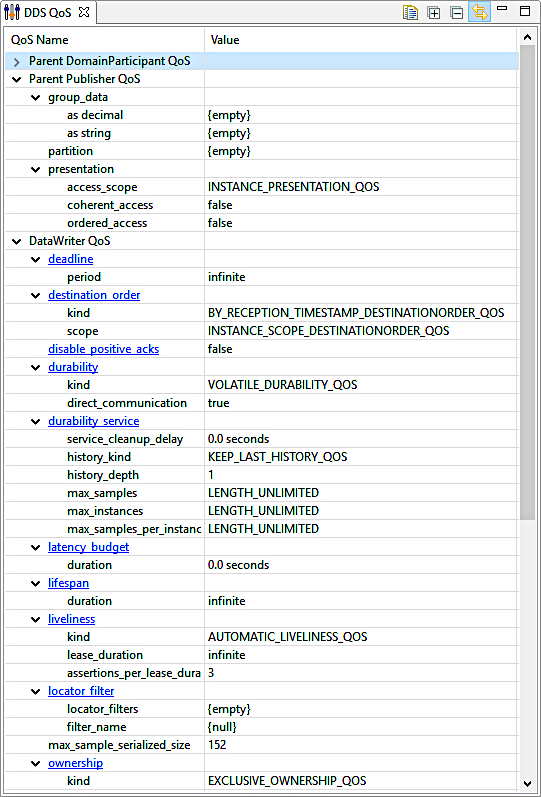
Want to find out more information about a particular QoS? Click on a hyperlinked row in the QoS Name column, and the documentation for that QoS will be displayed (active internet connection required).
The exclusive ownership setting can be seen right at the bottom of the DDS QoS View. This setting, however, is in conflict with the previously created DataReader. How can this be debugged? Select the Match Graph tab in the Topic View:
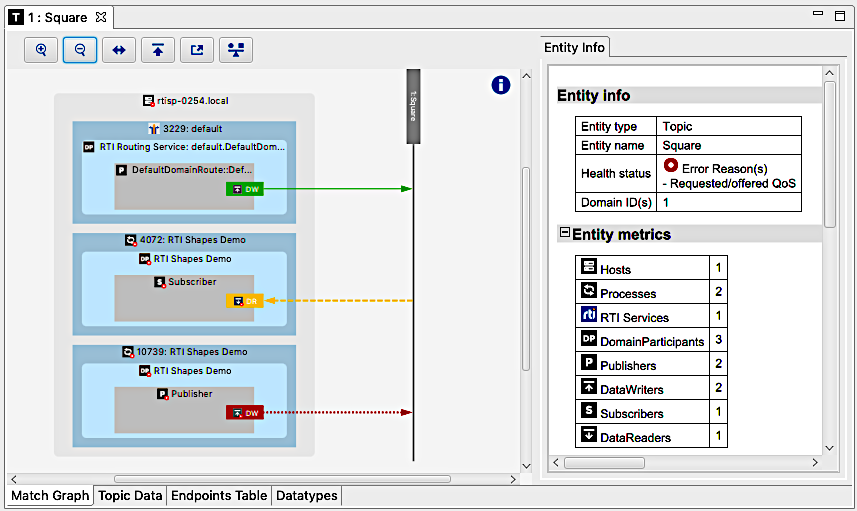
This tab shows that the newly created DataWriter with exclusive ownership is not matched to any DataReader associated with this Topic. This tab can also be used to drive other displays by selecting endpoints. But why does the Shapes Demo DataReader show that it is partially matched? Go ahead and select it and then turn your attention to the Match Analyses View.
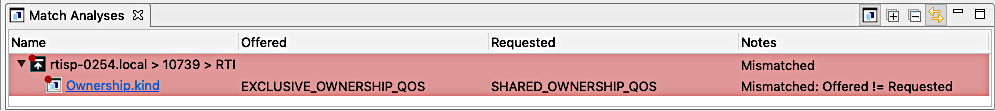
The Match Analyses view provides a comprehensive view into each match
analysis criterion as it pertains to each potential match for an entity
in the system. In our case, the mismatched ownership QoS is obvious.
But how can we see all of the criteria being checked in the match
analysis? Press the show/hide mismatches button .
Now each criterion is visible, whether it is a match or not.
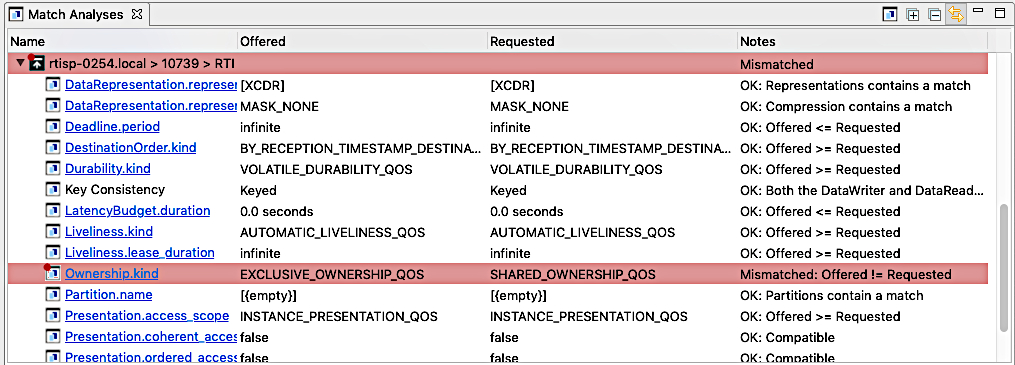
Want more information about how a match is determined for a particular row? Click on a hyperlinked entry in the Name column and the associated documentation will be displayed (active internet connection required).
Relevant reference topics: