6.3. Metrics
This section details the metrics you can collect from Connext entities.
Each metric has a unique name and specifies a general feature of a
measurable Connext resource.
For example, a Datawriter is a measurable resource; the
metric dds_datawriter_protocol_sent_heartbeats_total specifies the total
number of heartbeats sent by a DataWriter.
Observability Framework uses a Prometheus time-series database to store
collected metrics. A time series is an instantiation of a metric and
represents a stream of timestamped values (measurements) belonging to the
same resource as the metric. For example, we could have a time series for
the metric dds_datawriter_protocol_sent_heartbeats_total corresponding to a
DataWriter DW1 identified by a resource GUID GUID1.
Labels (or attributes) identify each metric instantiation or time series.
A label is a key-value pair that is associated with a metric. Any given
combination of labels for the same metric name identifies a specific
instantiation of that metric. For example, the metric
dds_datawriter_protocol_sent_heartbeats_total for the DataWriter
DW1 will have the label {guid= GUID1}. All metrics have at least one
label called guid that uniquely identifies a resource in a Connext system.
In Observability Framework there is a special kind of metric called a
presence metric. Presence metrics are used to indicate the existence of
a resource in a Connext system. For example, the
dds_participant_presence indicates the presence of a
Participant in a Connext system. There will be a time series for each
Participant ever created in the system. The labels associated
with a presence metric describe the resource, and they are dependent
on the type of resource. For example, a Participant resource has labels
such as `domain_id` and `name`.
For metrics that are not presence metrics, the only label is the guid
label identifying the resource to which the metrics apply. You can use
the guid label to query the description labels of a resource by
looking at the presence metric for the resource class.
6.3.1. Application Metrics
The following tables describe the metrics and labels generated for Connext
applications. Only the dds_application_presence metric has all of the application labels
listed in the table below. All other application metrics have the guid label
only.
Prometheus Label Name |
Description |
|---|---|
|
Application resource GUID |
|
Name of the host computer for the application |
|
Process ID for the application |
|
Fully qualified resource name (/applications/<AppName>) |
Prometheus Metric Name |
Description |
Type |
|---|---|---|
|
Indicates the presence of the application and provides all label values for an application instance |
Gauge |
|
The application resident memory utilization |
Gauge |
|
The application virtual memory utilization |
Gauge |
6.3.2. Participant Metrics
The following tables describe the metrics and labels generated for Connext
participants. Only the dds_participant_presence metric has all of the
participant labels listed in the table below. All other participant metrics
have the guid label only.
The Participant resource contains statistic variable metrics such as
dds_participant_udpv4_usage_in_net_pkts_count,
dds_participant_udpv4_usage_in_net_pkts_mean,
dds_participant_udpv4_usage_in_net_pkts_min, and
dds_participant_udpv4_usage_in_net_pkts_max.
These variables are interpreted as follows:
The metrics with suffix
_countrepresent the total number of packets or bytes over the last Prometheus scraping period.The metrics with suffix _min represent the minimum mean over the last Prometheus scraping period. For example,
dds_participant_udpv4_usage_in_net_pkts_mincontains the minimum packets/sec over the last scraping period. The min mean is calculated by choosing the minimum of individual mean values reported by Observability Library everyparticipant_factory_qos.monitoring.distribution_settings.periodic_settings.polling_period.The metrics with suffix
_maxrepresent the maximum mean over the last Prometheus scraping period. For example,dds_participant_udpv4_usage_in_net_pkts_maxcontains the maximum packets/sec over the last scraping period. The max mean is calculated by choosing the maximum of individual mean values reported by Observability Library everyparticipant_factory_qos.monitoring.distribution_settings.periodic_settings.polling_period.The metrics with suffix
_meanrepresent the mean over the last Prometheus scraping period. For example,dds_participant_udpv4_usage_in_net_pkts_meancontains the packets/sec over the last scraping period. If the scraping period is 30 seconds, the metric contains the packets/sec generated within the last 30 seconds. Thedds_participant_udpv4_usage_in_net_pkts_meanis calculated by averaging all individual mean metrics sent by Observability Library to Collector Service over the last scraping period.
Prometheus Label Name |
Description |
|---|---|
|
Participant resource GUID |
|
Resource GUID of the owner entity (application) |
|
Participant DDS GUID |
|
Name of the host computer for the participant |
|
Process ID for the participant |
|
DDS domain ID for the participant |
|
Connext architecture as described in the RTI Architecture Abbreviation column in the Platform Notes. |
|
Connext product version |
|
Fully qualified resource name (/applications/<AppName> /domain_participants/<ParticipantName>) |
Prometheus Metric Name |
Description |
Type |
|---|---|---|
|
Indicates the presence of the participant and provides all label values for a participant instance |
Gauge |
|
The UDPv4 transport in packets count over the last scraping period |
Gauge |
|
The UDPv4 transport in packets mean (packets/sec) over the last scraping period |
Gauge |
|
The UDPv4 transport in packets min mean (packets/sec) over the last scraping period |
Gauge |
|
The UDPv4 transport in packets max mean (packets/sec) over the last scraping period |
Gauge |
|
The UDPv4 transport in bytes count over the last scraping period |
Gauge |
|
The UDPv4 transport in bytes mean (bytes/sec) over the last scraping period |
Gauge |
|
The UDPv4 transport in bytes min mean (bytes/sec) over the last scraping period |
Gauge |
|
The UDPv4 transport in bytes max mean (bytes/sec) over the last scraping period |
Gauge |
|
The UDPv4 transport out packets count over the last scraping period |
Gauge |
|
The UDPv4 transport out packets mean (packets/sec) over the last scraping period |
Gauge |
|
The UDPv4 transport out packets min mean (packets/sec) over the last scraping period |
Gauge |
|
The UDPv4 transport out packets max mean (packets/sec) over the last scraping period |
Gauge |
|
The UDPv4 transport out bytes count over the last scraping period |
Gauge |
|
The UDPv4 transport out bytes mean (bytes/sec) over the last scraping period |
Gauge |
|
The UDPv4 transport out bytes min mean (bytes/sec) over the last scraping period |
Gauge |
|
The UDPv4 transport out bytes max mean (bytes/sec) over the last scraping perio |
Gauge |
|
The UDPv6 transport in packets count over the last scraping period |
Gauge |
|
The UDPv6 transport in packets mean (packets/sec) over the last scraping period |
Gauge |
|
The UDPv6 transport in packets min mean (packets/sec) over the last scraping period |
Gauge |
|
The UDPv6 transport in packets max mean (packets/sec) over the last scraping period |
Gauge |
|
The UDPv6 transport in bytes count over the last scraping period |
Gauge |
|
The UDPv6 transport in bytes mean (bytes/sec) over the last scraping period |
Gauge |
|
The UDPv6 transport in bytes min mean (bytes/sec) over the last scraping period |
Gauge |
|
The UDPv6 transport in bytes max mean (bytes/sec) over the last scraping period |
Gauge |
|
The UDPv6 transport out packets count over the last scraping period |
Gauge |
|
The UDPv6 transport out packets mean (packets/sec) over the last scraping period |
Gauge |
|
The UDPv6 transport out packets min mean (packets/sec) over the last scraping period |
Gauge |
|
The UDPv6 transport out packets max mean (packets/sec) over the last scraping period |
Gauge |
|
The UDPv6 transport out bytes count over the last scraping period |
Gauge |
|
The UDPv6 transport out bytes mean (bytes/sec) over the last scraping period |
Gauge |
|
The UDPv6 transport out bytes min mean (bytes/sec) over the last scraping period |
Gauge |
|
The UDPv6 transport out bytes max mean (bytes/sec) over the last scraping period |
Gauge |
6.3.3. Topic Metrics
The following tables describe the metrics and labels generated for Connext
topics. Only the dds_topic_presence metric has all of the topic labels listed
in the table below. All other topic metrics have the guid label only.
Prometheus Label Name |
Description |
|---|---|
|
Topic resource GUID |
|
Resource GUID of the owner entity (participant) |
|
Topic DDS GUID |
|
Name of the host computer for the participant this topic is registered with |
|
DDS domain ID for the participant this topic is registered with |
|
The topic name |
|
The registered type name for this topic |
|
Fully qualified resource name (/applications/<AppName>/domain_participants /<ParticipantName>/topics/<TopicName>) |
Prometheus Metric Name |
Description |
Type |
|---|---|---|
|
Indicates the presence of the topic and provides all label values for a topic instance |
Gauge |
|
See total_count field in the INCONSISTENT_TOPIC Status |
Counter |
6.3.4. DataWriter Metrics
The following tables describe the metrics and labels generated for Connext
DataWriters. Only the dds_datawriter_presence metric has all of the
DataWriter labels listed in the table below. All other DataWriter metrics
have the guid label only.
Prometheus Label Name |
Description |
|---|---|
|
DataWriter resource GUID |
|
Resource GUID of the owner entity (publisher) |
|
DataWriter DDS GUID |
|
Name of the host computer for the participant this DataWriter is registered with |
|
DDS domain ID for the participant this DataWriter is registered with |
|
The topic name for this DataWriter |
|
The registered type name for this DataWriter |
|
Fully qualified resource name (/applications/<AppName>/domain_participants /<ParticipantName>/publishers/<PublisherName>/data_writers/<DataWriterName>) |
|
Resource GUID of the participant this DataWriter is registered with |
Prometheus Metric Name |
Description |
Type |
|---|---|---|
|
Indicates the presence of the DataWriter and provides all label values for a DataWriter instance |
Gauge |
|
See test total_count field in the LIVELINESS_LOST Status |
Counter |
|
See total_count field in the OFFERED_DEADLINE_MISSED Status |
Counter |
|
See total_count field in the OFFERED_INCOMPATIBLE_QOS Status |
Counter |
|
See full_reliable_writer_cache field in the RELIABLE_WRITER_CACHE_CHANGED Status |
Counter |
|
See high_watermark_reliable_writer_cache field in the RELIABLE_WRITER_CACHE_CHANGED Status |
Counter |
|
See unacknowledged_sample_count field in the RELIABLE_WRITER_CACHE_CHANGED Status |
Gauge |
|
See unacknowledged_sample_count_peak field in the RELIABLE_WRITER_CACHE_CHANGED Status |
Gauge |
|
See replaced_unacknowledged_sample_count field in the RELIABLE_WRITER_CACHE_CHANGED Status |
Counter |
|
See inactive_count field in the RELIABLE_READER_ACTIVITY_CHANGED Status |
Gauge |
|
See sample_count_peak field in the DATA_WRITER_CACHE_STATUS |
Gauge |
|
See sample_count field in the DATA_WRITER_CACHE_STATUS |
Gauge |
|
See alive_instance_count field in the DATA_WRITER_CACHE_STATUS |
Gauge |
|
See alive_instance_count_peak field in the DATA_WRITER_CACHE_STATUS |
Gauge |
|
See pushed_sample_count field in the DATA_WRITER_PROTOCOL_STATUS |
Counter |
|
See pushed_sample_bytes field in the DATA_WRITER_PROTOCOL_STATUS |
Counter |
|
See sent_heartbeat_count field in the DATA_WRITER_PROTOCOL_STATUS |
Counter |
|
See pulled_sample_count field in the DATA_WRITER_PROTOCOL_STATUS |
Counter |
|
See pulled_sample_bytes field in the DATA_WRITER_PROTOCOL_STATUS |
Counter |
|
See received_nack_count field in the DATA_WRITER_PROTOCOL_STATUS |
Counter |
|
See received_nack_bytes field in the DATA_WRITER_PROTOCOL_STATUS |
Counter |
|
See send_window_size field in the DATA_WRITER_PROTOCOL_STATUS |
Gauge |
|
See pushed_fragment_count field in the DATA_WRITER_PROTOCOL_STATUS |
Counter |
|
See pushed_fragment_bytes field in the DATA_WRITER_PROTOCOL_STATUS |
Counter |
|
See pulled_fragment_count field in the DATA_WRITER_PROTOCOL_STATUS |
Counter |
|
See pulled_fragment_bytes field in the DATA_WRITER_PROTOCOL_STATUS |
Counter |
|
See received_nack_fragment_count field in the DATA_WRITER_PROTOCOL_STATUS |
Counter |
|
See received_nack_fragment_bytes field in the DATA_WRITER_PROTOCOL_STATUS |
Counter |
6.3.5. DataReader Metrics
The following tables describe the metrics and labels generated for Connext
DataReaders. Only the ddsd_datareader_presence metric has all of the
DataReader labels listed in the table below. All other DataReader metrics
have the guid label only.
Prometheus Label Name |
Description |
|---|---|
|
DataReader resource GUID |
|
Resource GUID of the owner entity (subscriber) |
|
DataReader DDS GUID |
|
Name of the host computer for the participant this DataReader is registered with |
|
DDS domain ID for the participant this DataReader is registered with |
|
The topic name for this DataReader |
|
The registered type name for this DataReader |
|
Fully qualified resource name (/applications/<AppName>/domain_participants/<ParticipantName> /publishers/<PublisherName>/data_readers/<DataReaderName>) |
|
Resource GUID of the participant this DataReader is registered with |
Prometheus Metric Name |
Description |
Type |
|---|---|---|
|
Indicates the presence of the DataReader and provides all label values for a DataReader instance |
Gauge |
|
See total_count field in the SAMPLE_REJECTED Status |
Counter |
|
See not_alive_count field in the LIVELINESS_CHANGED Status |
Gauge |
|
See total_count field in the REQUESTED_DEADLINE_MISSED Status |
Counter |
|
See total_count field in the REQUESTED_INCOMPATIBLE_QOS Status |
Counter |
|
See total_count field in the SAMPLE_LOST Status |
Counter |
|
See sample_count_peak field in the DATA_READER_CACHE_STATUS |
Gauge |
|
See sample_count field in the DATA_READER_CACHE_STATUS |
Gauge |
|
See old_source_timestamp_dropped_sample_count field in the DATA_READER_CACHE_STATUS |
Counter |
|
See tolerance_source_timestamp_dropped_sample_count field in the DATA_READER_CACHE_STATUS |
Counter |
|
See content_filter_dropped_sample_count field in the DATA_READER_CACHE_STATUS |
Counter |
|
See replaced_dropped_sample_count field in the DATA_READER_CACHE_STATUS |
Counter |
|
See total_samples_dropped_by_instance_replacement field in the DATA_READER_CACHE_STATUS |
Counter |
|
See alive_instance_count field in the DATA_READER_CACHE_STATUS |
Gauge |
|
See alive_instance_count_peak field in the DATA_READER_CACHE_STATUS |
Gauge |
|
See no_writers_instance_count field in the DATA_READER_CACHE_STATUS |
Gauge |
|
See no_writers_instance_count_peak field in the DATA_READER_CACHE_STATUS |
Gauge |
|
See disposed_instance_count field in the DATA_READER_CACHE_STATUS |
Gauge |
|
See disposed_instance_count_peak field in the DATA_READER_CACHE_STATUS |
Gauge |
|
See compressed_samples field in the DATA_READER_CACHE_STATUS |
Counter |
|
See received_sample_count field in the DATA_READER_PROTOCOL_STATUS |
Counter |
|
See received_sample_bytes field in the DATA_READER_PROTOCOL_STATUS |
Counter |
|
See duplicate_sample_count field in the DATA_READER_PROTOCOL_STATUS |
Counter |
|
See duplicate_sample_bytes field in the DATA_READER_PROTOCOL_STATUS |
Counter |
|
See received_heartbeat_count field in the DATA_READER_PROTOCOL_STATUS |
Counter |
|
See sent_nack_count field in the DATA_READER_PROTOCOL_STATUS |
Counter |
|
See sent_nack_bytes field in the DATA_READER_PROTOCOL_STATUS |
Counter |
|
See rejected_sample_count field in the DATA_READER_PROTOCOL_STATUS |
Counter |
|
See out_of_range_rejected_sample_count field in the DATA_READER_PROTOCOL_STATUS |
Counter |
|
See received_fragment_count field in the DATA_READER_PROTOCOL_STATUS |
Counter |
|
See dropped_fragment_count field in the DATA_READER_PROTOCOL_STATUS |
Counter |
|
See reassembled_sample_count field in the DATA_READER_PROTOCOL_STATUS |
Counter |
|
See sent_nack_fragment_count field in the DATA_READER_PROTOCOL_STATUS |
Counter |
|
See sent_nack_fragment_bytes field in the DATA_READER_PROTOCOL_STATUS |
Counter |
6.3.6. Derived Metrics Generated by Prometheus Recording Rules
Prometheus provides a capability called Recording Rules. The following text is an excerpt from the Prometheus documentation.
Recording rules allow you to precompute frequently needed or computationally
expensive expressions and save their result as a new set of time series.
Querying the precomputed result will then often be much faster than executing
the original expression every time it is needed. This is especially useful for
dashboards, which need to query the same expression repeatedly every time they
refresh.
A Prometheus recording rule generates a new metric time series with new values calculated at the frequency at which the rule is run. The recording rules in Observability Framework are run every 10 seconds, meaning there is an evaluation and update to the associated derived metric every 10 seconds. Observability Framework uses Prometheus recording rules to generate three types of derived metrics.
DDS entity proxy metrics
raw
errormetricsaggregated
errormetrics.
Each of these derived metric types is discussed in detail below.
The Grafana dashboards provided with Observability Framework make use of
the error metrics generated by Prometheus recording rules. The aggregated
error metrics are used on the Alert Home dashboard, while the raw error
metrics are used on other dashboards.
6.3.6.1. DDS Entity Proxy Metrics
The DDS entity proxy metrics are used in the recording rules for the raw error
metrics and are always 0. The proxy metrics are used to make sure the rules
evaluate to known good values in cases where the underlying metrics are not
available.
Prometheus Metric Name |
Description |
|---|---|
|
A proxy for applications metrics that always provides a value of zero. |
|
A proxy for applications metrics that always provides a value of zero. |
|
A proxy for applications metrics that always provides a value of zero. |
|
A proxy for applications metrics that always provides a value of zero. |
|
A proxy for applications metrics that always provides a value of zero. |
6.3.6.2. Raw Error Metrics
Raw error metrics are derived for select metrics by doing a boolean
comparison to a predefined limit. The raw error metrics are created by
converting the monotonically increasing value of a counter metric into a
rate, comparing that rate to a limit, and returning a boolean value. The
returned boolean value is 1 if the limit is exceeded, or otherwise
0. In the Grafana dashboards, a value of 0 indicates a healthy
condition for the error metric, while a value of 1 indicates a
fail condition.
Recording rules have been created to generate a derived raw error metric for
all of the metrics listed in Table 6.13 and
Table 6.14.
Table 6.13 lists derived
Raw error metrics that are “enabled”. The rules for the “enabled” metrics
test if the underlying metric has exceeded a limit of 0. Note the
>bool 0 comparison operator in each of the recording rules. A value greater
than 0 in any of these metrics will result in an alert indication in the
dashboards. This set of metrics is “enabled” because any
increase in the underlying metric indicates an unexpected condition in DDS.
Prometheus Metric Name |
Recording Rule |
|---|---|
|
rate(dds_datareader_cache_content_filter_dropped_samples_total[1m]) >bool 0 or dds_datareader_empty_metric |
|
rate(dds_datareader_cache_replaced_dropped_samples_total[1m]) >bool 0 or dds_datareader_empty_metric |
|
rate(dds_datareader_cache_samples_dropped_by_instance_replacement_total[1m]) >bool 0 or dds_datareader_empty_metric |
|
rate(dds_datareader_protocol_rejected_samples_total[1m]) >bool 0 or dds_datareader_empty_metric |
|
rate(dds_datareader_protocol_out_of_range_rejected_samples_total[1m]) >bool 0 or dds_datareader_empty_metric |
|
rate(dds_datareader_protocol_dropped_fragments_total[1m]) >bool 0 or dds_datareader_empty_metric |
|
rate(dds_topic_inconsistent_total[1m]) >bool 0 or dds_topic_empty_metric |
|
rate(dds_datawriter_incompatible_qos_total[1m]) >bool 0 or dds_datawriter_empty_metric |
|
rate(dds_datareader_incompatible_qos_total[1m]) >bool 0 or dds_datareader_empty_metric |
|
rate(dds_datawriter_liveliness_lost_total[1m]) >bool 0 or dds_datawriter_empty_metric |
|
rate(dds_datawriter_reliable_reader_activity_inactive_count[1m]) >bool 0 or dds_datawriter_empty_metric |
|
rate(dds_datareader_liveliness_not_alive_count[1m]) >bool 0 or dds_datareader_empty_metric |
|
rate(dds_datareader_cache_tolerance_source_timestamp_dropped_samples_total[1m]) >bool 0 or dds_datareader_empty_metric |
|
rate(dds_datawriter_deadline_missed_total[1m]) >bool 0 or dds_datawriter_empty_metric |
|
rate(dds_datareader_deadline_missed_total[1m]) >bool 0 or dds_datareader_empty_metric |
|
rate(dds_datawriter_reliable_cache_replaced_unacknowledged_samples_total[1m]) >bool 0 or dds_datawriter_empty_metric |
|
rate(dds_datareader_sample_lost_total[1m]) >bool 0 or dds_datareader_empty_metric |
Table Table 6.14 lists derived
raw error metrics that are “disabled”. The rules for the “disabled” metrics
test to see if the underlying metric is less than a limit of 0, ensuring that
the derived raw error metric never indicates a failure. Note the <bool 0
comparison operator in each of the recording rules. This set of metrics is
“disabled” because a meaningful limit that would indicate a fail condition
cannot be determined without additional knowledge of the system.
For instructions on how to enable these metrics, see Enable a Raw Error Metric.
Prometheus Metric Name |
Recording Rule |
|---|---|
|
rate(dds_datawriter_protocol_sent_heartbeats_total[1m] <bool 0 or dds_datawriter_empty_metric |
|
rate(dds_datawriter_protocol_received_nacks_total[1m]) <bool 0 or dds_datawriter_empty_metric |
|
rate(dds_datawriter_protocol_received_nack_bytes_total[1m]) <bool 0 or dds_datawriter_empty_metric |
|
rate(dds_datawriter_protocol_received_nack_fragments_total[1m]) <bool 0 or dds_datawriter_empty_metric |
|
rate(dds_datawriter_protocol_received_nack_fragment_bytes_total[1m]) <bool 0 or dds_datawriter_empty_metric |
|
rate(dds_datareader_protocol_received_heartbeats_total[1m]) <bool 0 or dds_datareader_empty_metric |
|
rate(dds_datareader_protocol_sent_nacks_total[1m]) <bool 0 or dds_datareader_empty_metric |
|
rate(dds_datareader_protocol_sent_nack_bytes_total[1m]) <bool 0 or dds_datareader_empty_metric |
|
rate(dds_datareader_protocol_sent_nack_fragments_total[1m]) <bool 0 or dds_datareader_empty_metric |
|
rate(dds_datareader_protocol_sent_nack_fragment_bytes_total[1m]) <bool 0 or dds_datareader_empty_metric |
|
rate(dds_datawriter_protocol_pulled_samples_total[1m]) <bool 0 or dds_datawriter_empty_metric |
|
rate(dds_datawriter_protocol_pulled_sample_bytes_total[1m]) <bool 0 or dds_datawriter_empty_metric |
|
rate(dds_datawriter_protocol_pulled_fragments_total[1m]) <bool 0 or dds_datawriter_empty_metric |
|
rate(dds_datawriter_protocol_pulled_fragment_bytes_total[1m]) <bool 0 or dds_datawriter_empty_metric |
|
rate(dds_datawriter_protocol_pushed_samples_total[1m]) <bool 0 or dds_datawriter_empty_metric |
|
rate(dds_datawriter_protocol_pushed_sample_bytes_total[1m]) <bool 0 or dds_datawriter_empty_metric |
|
rate(dds_datawriter_protocol_pushed_fragments_total[1m]) <bool 0 or dds_datawriter_empty_metric |
|
rate(dds_datawriter_protocol_pushed_fragment_bytes_total[1m]) <bool 0 or dds_datawriter_empty_metric |
|
rate(dds_datareader_cache_compressed_samples_total[1m]) <bool 0 or dds_datareader_empty_metric |
|
rate(dds_datareader_protocol_duplicate_samples_total[1m]) <bool 0 or dds_datareader_empty_metric |
|
rate(dds_datareader_protocol_duplicate_sample_bytes_total[1m]) <bool 0 or dds_datareader_empty_metric |
|
rate(dds_datareader_protocol_received_samples_total[1m]) <bool 0 or dds_datareader_empty_metric |
|
rate(dds_datareader_protocol_received_sample_bytes_total[1m]) <bool 0 or dds_datareader_empty_metric |
|
rate(dds_datareader_protocol_received_fragments_total[1m]) <bool 0 or dds_datareader_empty_metric |
|
rate(dds_datareader_protocol_reassembled_samples_total[1m]) <bool 0 or dds_datareader_empty_metric |
|
rate(dds_application_process_utilization_memory_usage_resident_memory_bytes[1m]) <bool 0 or dds_application_empty_metric |
|
rate(dds_application_process_utilization_memory_usage_virtual_memory_bytes[1m]) <bool 0 or dds_application_empty_metric |
|
rate(dds_participant_udpv4_usage_in_net_pkts_mean[1m]) <bool 0 or dds_participant_empty_metric |
|
rate(dds_participant_udpv4_usage_in_net_bytes_mean[1m]) <bool 0 or dds_participant_empty_metric |
|
rate(dds_participant_udpv4_usage_out_net_pkts_mean[1m]) <bool 0 or dds_participant_empty_metric |
|
rate(dds_participant_udpv4_usage_out_net_bytes_mean[1m]) <bool 0 or dds_participant_empty_metric |
|
rate(dds_participant_udpv6_usage_in_net_pkts_mean[1m]) <bool 0 or dds_participant_empty_metric |
|
rate(dds_participant_udpv6_usage_in_net_bytes_mean[1m]) <bool 0 or dds_participant_empty_metric |
|
rate(dds_participant_udpv6_usage_out_net_pkts_mean[1m]) <bool 0 or dds_participant_empty_metric |
|
rate(dds_participant_udpv6_usage_out_net_bytes_mean[1m]) <bool 0 or dds_participant_empty_metric |
|
rate(dds_datawriter_reliable_cache_full_total[1m]) <bool 0 or dds_datawriter_empty_metric |
|
rate(dds_datawriter_reliable_cache_high_watermark_total[1m]) <bool 0 or dds_datawriter_empty_metric |
|
rate(dds_datawriter_reliable_cache_unacknowledged_samples[1m]) <bool 0 or dds_datawriter_empty_metric |
|
rate(dds_datawriter_reliable_cache_unacknowledged_samples_peak[1m]) <bool 0 or dds_datawriter_empty_metric |
|
rate(dds_datawriter_protocol_send_window_size[1m]) <bool 0 or dds_datawriter_empty_metric |
|
rate(dds_datawriter_cache_samples[1m]) <bool 0 or dds_datawriter_empty_metric |
|
rate(dds_datawriter_cache_samples_peak[1m]) <bool 0 or dds_datawriter_empty_metric |
|
rate(dds_datawriter_cache_alive_instances[1m]) <bool 0 or dds_datawriter_empty_metric |
|
rate(dds_datawriter_cache_alive_instances_peak[1m]) <bool 0 or dds_datawriter_empty_metric |
|
rate(dds_datareader_sample_rejected_total[1m]) <bool 0 or dds_datareader_empty_metric |
|
rate(dds_datareader_cache_samples[1m]) <bool 0 or dds_datareader_empty_metric |
|
rate(dds_datareader_cache_samples_peak[1m]) <bool 0 or dds_datareader_empty_metric |
|
rate(dds_datareader_cache_alive_instances[1m]) <bool 0 or dds_datareader_empty_metric |
|
rate(dds_datareader_cache_alive_instances_peak[1m]) <bool 0 or dds_datareader_empty_metric |
|
rate(dds_datareader_cache_no_writers_instances[1m]) <bool 0 or dds_datareader_empty_metric |
|
rate(dds_datareader_cache_no_writers_instances_peak[1m]) <bool 0 or dds_datareader_empty_metric |
|
rate(dds_datareader_cache_disposed_instances[1m]) <bool 0 or dds_datareader_empty_metric |
|
rate(dds_datareader_cache_disposed_instances_peak[1m]) <bool 0 or dds_datareader_empty_metric |
|
rate(dds_datareader_cache_old_source_timestamp_dropped_samples_total[1m]) <bool 0 or dds_datareader_empty_metric |
6.3.6.3. Aggregated Error Metrics
The aggregated error metrics create a status roll-up for a group of metrics
in a particular category. These aggregated error metrics are used in the
Alert Home dashboard to provide a high-level view of alerts grouped by category.
The categories are Bandwidth, Saturation, Data Loss, System Errors,
and Delays. The aggregated error metrics are created by adding together
all of the raw error metrics assigned to a category and clamping the values
at 1, the value that indicates a failed condition.
Table 6.15 shows all of the aggregated error
metrics and the rule used to generate them. Note the use of the raw
error metrics in the rules.
Prometheus Metric Name |
Recording Rule |
|---|---|
|
clamp_max ((sum (dds_custom_excessive_bandwidth_errors) + sum (dds_datawriter_protocol_sent_heartbeats_errors) + sum (dds_datawriter_protocol_received_nacks_errors) + sum (dds_datawriter_protocol_received_nack_bytes_errors) + sum (dds_datawriter_protocol_received_nack_fragments_errors) + sum (dds_datawriter_protocol_received_nack_fragment_bytes_errors) + sum (dds_datareader_protocol_received_heartbeats_errors) + sum (dds_datareader_protocol_sent_nacks_errors) + sum (dds_datareader_protocol_sent_nack_bytes_errors) + sum (dds_datareader_protocol_sent_nack_fragments_errors) + sum (dds_datareader_protocol_sent_nack_fragment_bytes_errors) + sum (dds_datawriter_protocol_pulled_samples_errors) + sum (dds_datawriter_protocol_pulled_sample_bytes_errors) + sum (dds_datawriter_protocol_pulled_fragments_errors) + sum (dds_datawriter_protocol_pulled_fragment_bytes_errors) + sum (dds_datawriter_protocol_pushed_samples_errors) + sum (dds_datawriter_protocol_pushed_sample_bytes_errors) + sum (dds_datawriter_protocol_pushed_fragments_errors) + sum (dds_datawriter_protocol_pushed_fragment_bytes_errors) + sum (dds_datareader_cache_content_filter_dropped_samples_errors) + sum (dds_datareader_cache_compressed_samples_errors) + sum (dds_datareader_protocol_duplicate_samples_errors) + sum (dds_datareader_protocol_duplicate_sample_bytes_errors) + sum (dds_datareader_protocol_received_samples_errors) + sum (dds_datareader_protocol_received_sample_bytes_errors) + sum (dds_datareader_protocol_received_fragments_errors) + sum (dds_datareader_protocol_reassembled_samples_errors)), 1) |
|
clamp_max ((sum (dds_custom_saturation_errors) + sum (dds_application_process_utilization_memory_usage_resident_memory_bytes_errors) + sum (dds_application_process_utilization_memory_usage_virtual_memory_bytes_errors) + sum (dds_participant_udpv4_usage_in_net_pkts_errors) + sum (dds_participant_udpv4_usage_in_net_bytes_errors) + sum (dds_participant_udpv4_usage_out_net_pkts_errors) + sum (dds_participant_udpv4_usage_out_net_bytes_errors) + sum (dds_participant_udpv6_usage_in_net_pkts_errors) + sum (dds_participant_udpv6_usage_in_net_bytes_errors) + sum (dds_participant_udpv6_usage_out_net_pkts_errors) + sum (dds_participant_udpv6_usage_out_net_bytes_errors) + sum (dds_datawriter_reliable_cache_full_errors) + sum (dds_datawriter_reliable_cache_high_watermark_errors) + sum (dds_datawriter_reliable_cache_unacknowledged_samples_errors) + sum (dds_datawriter_reliable_cache_unacknowledged_samples_peak_errors) + sum (dds_datawriter_protocol_send_window_size_errors) + sum (dds_datawriter_cache_samples_errors) + sum (dds_datawriter_cache_samples_peak_errors) + sum (dds_datawriter_cache_alive_instances_errors) + sum (dds_datawriter_cache_alive_instances_peak_errors) + sum (dds_datareader_sample_rejected_errors) + sum (dds_datareader_cache_samples_errors) + sum (dds_datareader_cache_samples_peak_errors) + sum (dds_datareader_cache_replaced_dropped_samples_errors) + sum (dds_datareader_cache_samples_dropped_by_instance_replacement_errors) + sum (dds_datareader_cache_alive_instances_errors) + sum (dds_datareader_cache_alive_instances_peak_errors) + sum (dds_datareader_cache_no_writers_instances_errors) + sum (dds_datareader_cache_no_writers_instances_peak_errors) + sum (dds_datareader_cache_disposed_instances_errors) + sum (dds_datareader_cache_disposed_instances_peak_errors) + sum (dds_datareader_protocol_rejected_samples_errors) + sum (dds_datareader_protocol_out_of_range_rejected_samples_errors) + sum (dds_datareader_protocol_dropped_fragments_errors)), 1) |
|
clamp_max ((sum (dds_custom_errors) + sum (dds_topic_inconsistent_errors) + sum (dds_datawriter_incompatible_qos_errors) + sum (dds_datareader_incompatible_qos_errors) + sum (dds_datawriter_liveliness_lost_errors) + sum (dds_datawriter_reliable_reader_activity_inactive_count_errors) + sum (dds_datareader_liveliness_not_alive_count_errors) + sum (dds_datareader_cache_old_source_timestamp_dropped_samples_errors) + sum (dds_datareader_cache_tolerance_source_timestamp_dropped_samples_errors)), 1) |
|
clamp_max ((sum (dds_custom_delays_errors) + sum (dds_datawriter_deadline_missed_errors) + sum (dds_datareader_deadline_missed_errors)), 1) |
|
clamp_max ((sum (dds_custom_data_loss_errors) + sum (dds_datawriter_reliable_cache_replaced_unacknowledged_samples_errors) + sum (dds_datareader_sample_lost_errors) + sum (dds_datareader_cache_replaced_dropped_samples_errors) + sum (dds_datareader_cache_samples_dropped_by_instance_replacement_errors) + sum (dds_datareader_cache_tolerance_source_timestamp_dropped_samples_errors)), 1) |
6.3.6.4. Enable a Raw Error Metric
Note
The Grafana user must have Admin privileges to make any changes to the Grafana dashboards.
Use the following steps to enable any of the “disabled” metrics in your system:
Update the raw
errorrule to enable the calculation and provide a limit. See Update the Recording Rule for the Derived Metric below.Update the Alert “Category” dashboard to update the background color of the OK/ERROR and State panels for the enabled metric. See Update the Alert “Category” Dashboard below.
Update the “Entity” status dashboard to update the query and background color in the State panel. See Update the “Entity” Status Dashboard below.
The example that follows uses the dds_datareader_cache_alive_instances_errors
metric to update/enable a rule to detect any DataReader that has more
than 3 ALIVE instances in its cache.
6.3.6.4.1. Update the Recording Rule for the Derived Metric
Locate the recording rule for the dds_datareader_cache_alive_instances_errors
metric in the monitoring_recording_rules.yml file located in the
rti_workspace/7.1.0/observability/prometheus directory.
 # User Config Required
   - record: dds_datareader_cache_alive_instances_errors
     expr: >
       rate(dds_datareader_cache_alive_instances[1m]) <bool 0 or dds_datareader_empty_metric
The dds_datareader_cache_alive_instances metric is a gauge metric, meaning we
want to use the absolute value for our limit check rather than the rate. In the
following example recording rule, we want to update the limit test so that the error
will be active whenever the value is greater than 3.
 # User Config Required
   - record: dds_datareader_cache_alive_instances_errors
     expr: >
       dds_datareader_cache_alive_instances >bool 3 or dds_datareader_empty_metric
Important
After updating the monitoring_recording_rules.yml file, you must restart
all Docker containers for Observability Framework by running rtiobservability -t
followed by rtiobservability -s. The Prometheus server will read the updated
file after restarting the containers.
6.3.6.4.2. Update the Alert “Category” Dashboard
Locate the Alert “Category” dashboard for the metric rule you are enabling.
The metric in our example, dds_datareader_cache_alive_instances_errors,
is in the Saturation group (see Table Table 6.15),
so the Alert Saturation dashboard is used in the following steps.
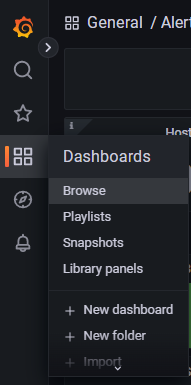
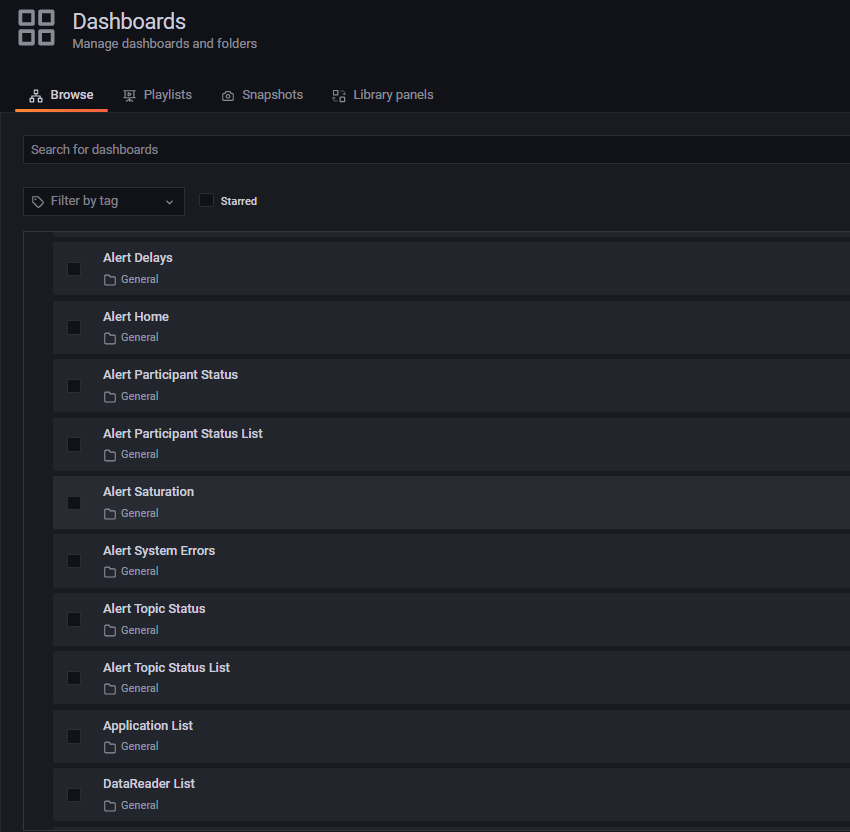
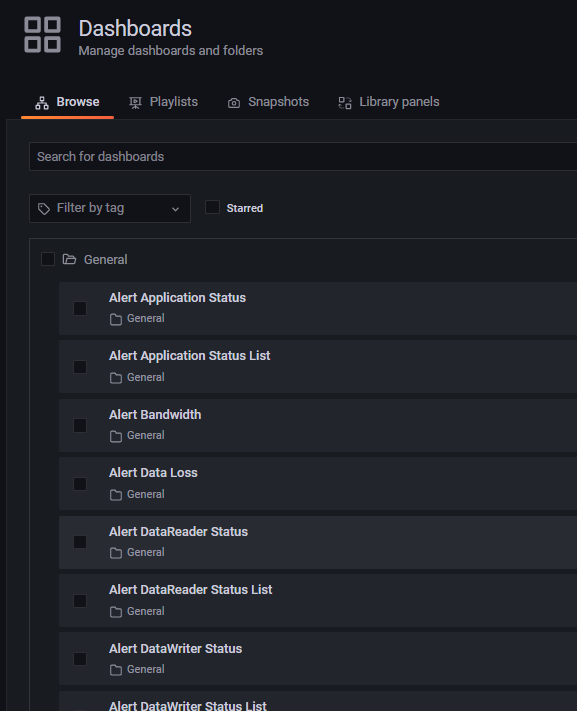
Go to Dashboards > Browse to open the list of dashboards.
Select the Alert Saturation dashboard from the list.
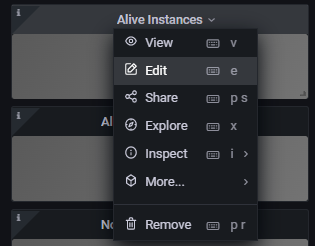
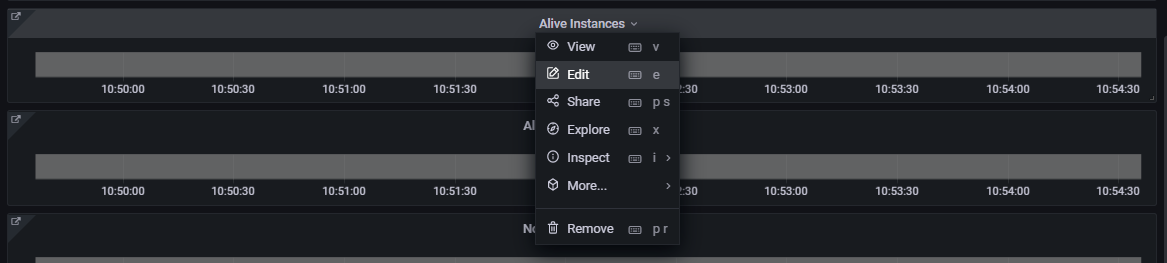
Once on the Alert Saturation dashboard, scroll down to the Alive Instances row under the Reader Cache section.

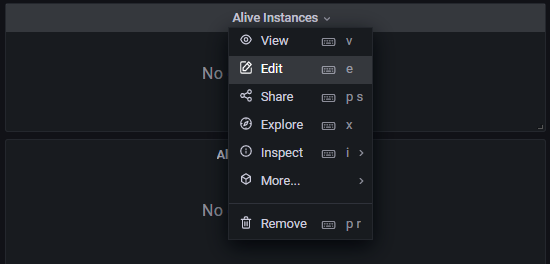
Select Alive Instances > Edit from the status indicator panel menu.
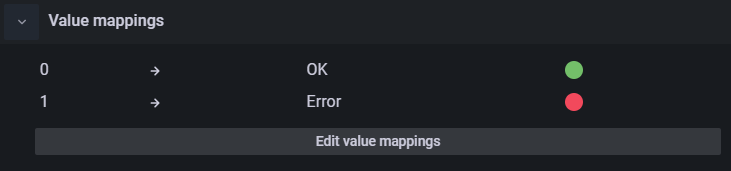
In the right panel, scroll down until you find the Value mappings section.
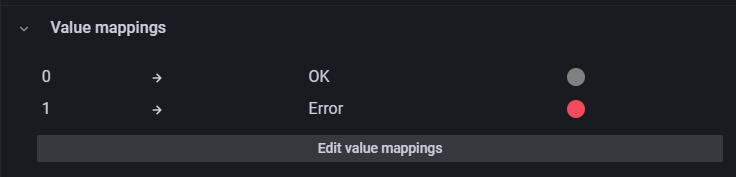
Click the gray color circle next to the OK mapping to select a new color for the panel “OK” indication.
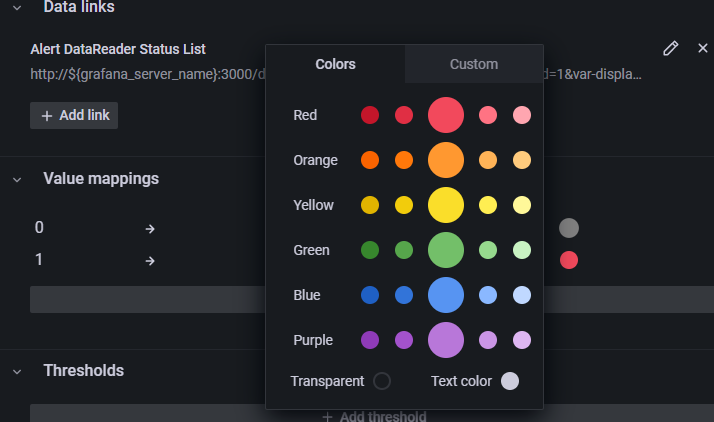
Select the large green circle in the panel. The updated OK value should change from gray to green.
Select Apply at the top right to apply the change and return to the Alert Saturation dashboard.

Select Alive Instances > Edit from the status indicator panel menu.
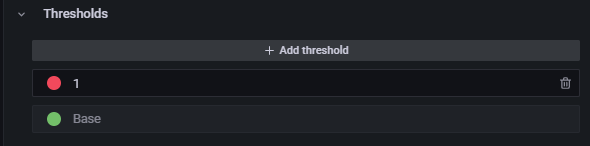
In the right panel, scroll down to the Thresholds section.
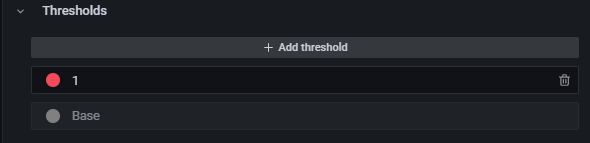
Click the gray circle next to Base to select a new base color for the Thresholds panel.
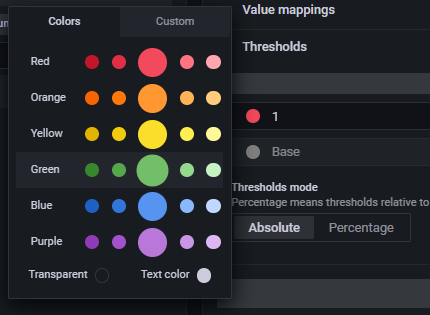
Select the large green circle in the panel. The updated Threshold base value should change to green.
Select Apply at the top right to apply the changes and return to the Alert Saturation dashboard.
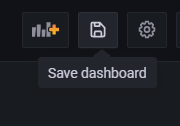
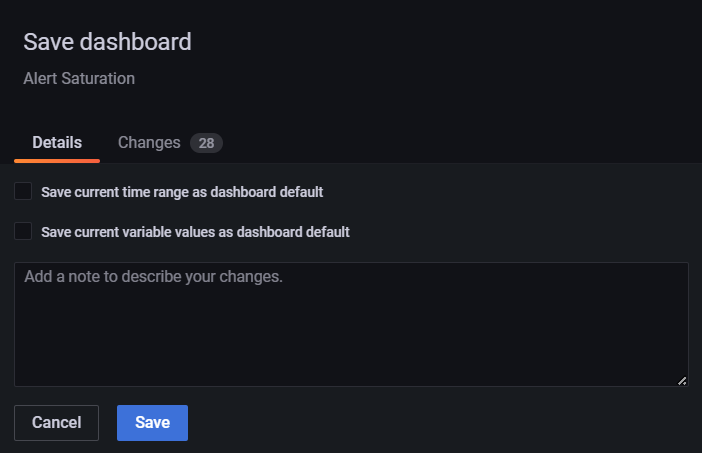
Select the Save Dashboard icon at the top right.
When prompted to confirm, select Save.
The Alive Instances row under the Reader Cache section should now be green, indicating it is enabled.

6.3.6.4.3. Update the “Entity” Status Dashboard
Locate the “Entity” status dashboard for the metric rule you are enabling. For
the metric in our example, dds_datareader_cache_alive_instances_errors,
we need to update the Alert DataReader Status dashboard.
Go to Dashboards > Browse to open the list of dashboards.
Select the Alert DataReader Status dashboard from the list.
Once on the Alert DataReader Status dashboard, scroll down to the Alive Instances row under the Saturation/Reader Cache section.

Select Alive Instances > Edit from the status indicator panel menu.
The query for the panel is shown below.
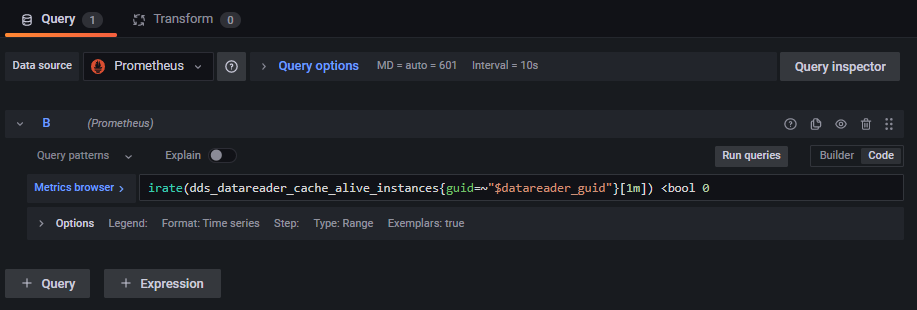
Edit the query to match the rule that was created for the
dds_datareader_cache_alive_instances_errorsmetric. In the Metrics browser field, remove the irate calculation and set the limit check to>bool 3, as shown below.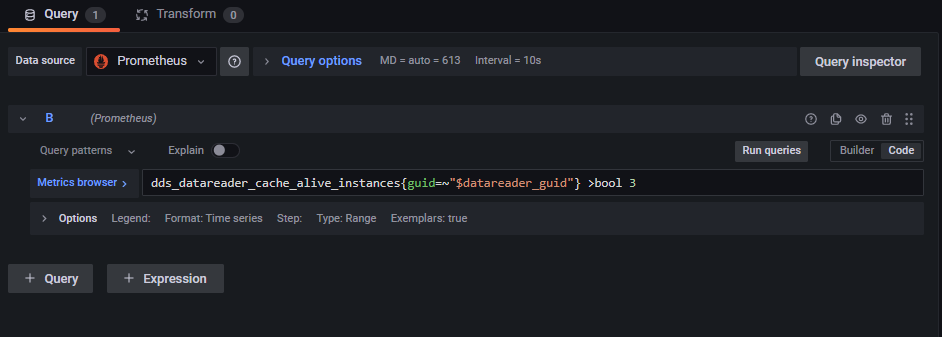
In the right panel, scroll down to the Thresholds section.
Click the gray circle next to Base to select a new base color for the Thresholds panel.
Select the large green circle in the panel. The updated Threshold base value should change from gray to green.
Select Apply at the top right to apply the change and return to the Alert DataReader Status dashboard.
Select the Save Dashboard icon at the top right.
When prompted to confirm, select Save.
You have now enabled a rule for dds_datareader_cache_alive_instances that
detects any DataReader that has more than 3 sample instances in its queue with
an instance state of ALIVE. The indication of this condition will display on
all relevant dashboards.
You can test this rule by running the applications as
described in section Start the Applications. Start any
combination of publishing applications with the -s, --sensor-count
command-line arguments totaling more than 3. Anytime this condition occurs,
you will see this error indicated.
6.3.6.5. Custom Error Metrics
Table Table 6.16 shows metrics that are not fully implemented.
Prometheus Metric Name |
Description |
|---|---|
|
Not fully implemented. Not to be modified or used. |
|
Not fully implemented. Not to be modified or used. |
|
Not fully implemented. Not to be modified or used. |
|
Not fully implemented. Not to be modified or used. |
|
Not fully implemented. Not to be modified or used. |