2. Deployments
This section describes deployment options for the Observability Framework components and supporting third-party software used for telemetry data storage and visualization. There are two deployment options:
Evaluation Deployment: This deployment is intended for initial product evaluation only using the full version of Collector Service. All Observability Framework and third-party components are deployed and run in a single host.
Production Deployment: This deployment is intended for production use. Observability Framework and third-party components are deployed separately.
2.1. Before You Begin
Each deployment option requires the Monitoring Library 2.0 component to collect telemetry data from Connext applications. It is included with Connext Professional as both a shared and a static library, named rtimonitoring2.
Before deploying the other Observability Framework components needed for your deployment scenario and use case, you must instrument your Connext applications with Monitoring Library 2.0. See the Monitoring Library 2.0 chapter for details on how to enable and configure it.
2.2. Evaluation Deployment
Note
The evaluation deployment uses the full version of Collector Service. Collector Service Lite is not included in this deployment option.
To evaluate Observability Framework, Connext Professional enables you to deploy and run Collector Service and third-party components Prometheus, Grafana Loki, Grafana, OpenTelemetry Collector (optional), and NGINX (optional) using Docker Compose™ in a single Linux® x86 host. This Docker Compose deployment allows you to evaluate both use cases of the Observability Framework: real-time remote debugging and operational monitoring.
Warning
This deployment option is not intended for production use. It is intended for initial product evaluation only.
Everything required to install and run Observability Framework for evaluation is included in Connext Professional. For installation and usage details, see Installation and Observability Framework for Evaluation. For an example you can use to evaluate Observability Framework, see the Tutorial.
An evaluation installation provides two deployment scenarios: one without OpenTelemetry Collector and one with OpenTelemetry Collector. Both deployments can be configured to be secure or non-secure and to work on a LAN or WAN.
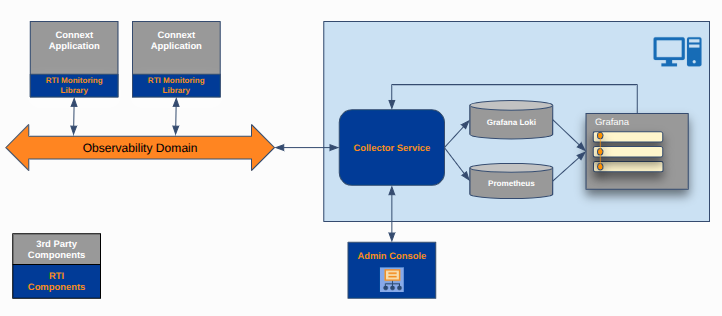
Figure 2.1 RTI Observability Framework without OpenTelemetry Collector
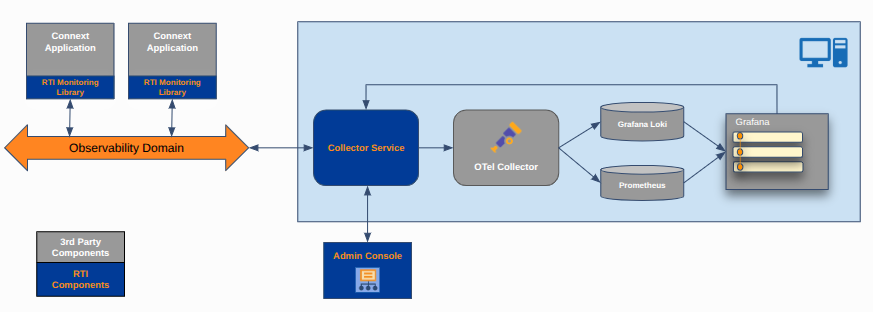
Figure 2.2 RTI Observability Framework with OpenTelemetry Collector
2.3. Production Deployments
In a production environment, the Observability Framework and supporting third-party components are deployed separately—potentially on different hosts or pods within a Kubernetes cluster. Monitoring Library 2.0, Collector Service and Collector Service Lite executables are installed with Connext Professional. For details on how to use the Collector Service and Collector Service Lite executables, see Collector Service Usage.
The two Collector Service components are also distributed as Docker images. The Collector Service and Collector Service Lite images are hosted on RTI’s Docker Hub registry. Both the Collector Service and Collector Service Lite images require a valid RTI license to run.
The Collector Service image is the same one used by the Docker Compose installation described in Evaluation Deployment. For details on how to use the images, see the Collector Service chapter.
The third-party components Prometheus, Grafana Loki, Grafana, OpenTelemetry Collector (optional), and NGINX (optional) must also be installed separately, if you are using them.
A production installation provides several deployment scenarios, described in the following sections. Each scenario notes the builtin configuration(s) required to deploy the Collector Service instances. Note that Collector Service Lite can be substituted for Collector Service anywhere a Collector Service Lite-compatible builtin configuration is specified. For more information, see the Configuration section.
2.3.1. Single Collector Service instance
This production deployment scenario is the simplest: a single Collector Service instance is deployed to collect telemetry data from multiple Connext applications. The instance is configured to store telemetry data in Prometheus and Grafana Loki, and to provide remote debugging telemetry to Admin Console.
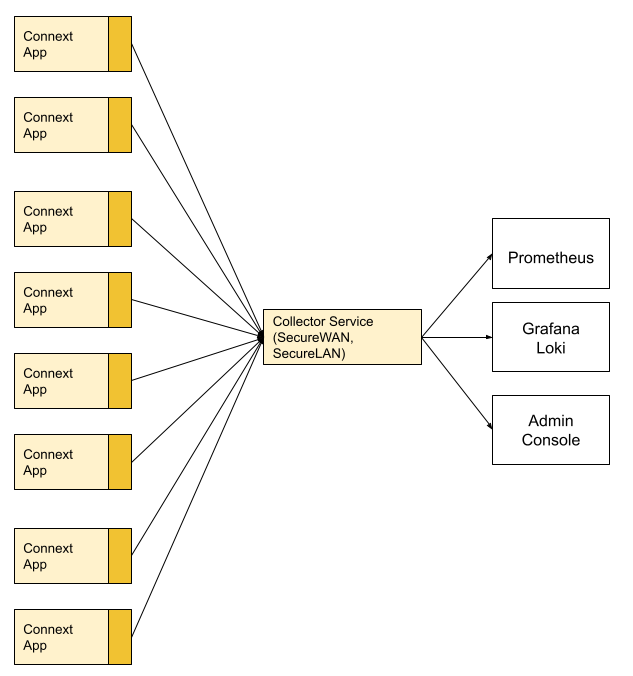
Figure 2.3 Single Collector Service Instance
2.3.2. Single layer of Collector Service instances
This production deployment scenario includes multiple Collector Service instances in a single layer. Each Collector Service instance collects telemetry data from multiple Connext applications and makes it available to Prometheus and Grafana Loki.
This scenario is not well-suited for remote debugging because Admin Console can only connect to a single Collector Service instance at a time.
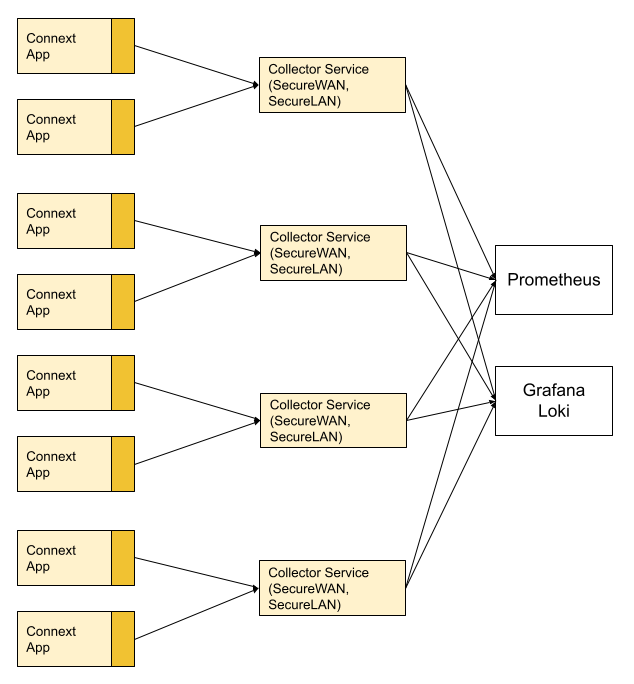
Figure 2.4 Single Layer of Collector Service Instances
2.3.3. Multiple layers of Collector Service instances
This deployment scenario includes two layers of Collector Service instances. The first layer collects telemetry data from multiple Connext applications and forwards it to the second layer containing a single Collector Service. The second layer is configured to store telemetry data in Prometheus and Grafana Loki, and to provide remote debugging telemetry to Admin Console.
The first layer can be horizontally scaled by adding more Collector Service instances to handle more applications or cover multiple geographically distributed sites. These instances forward their data to a smaller number of second-layer Collector Service instances—often just one—that aggregate and export the consolidated telemetry to external systems.
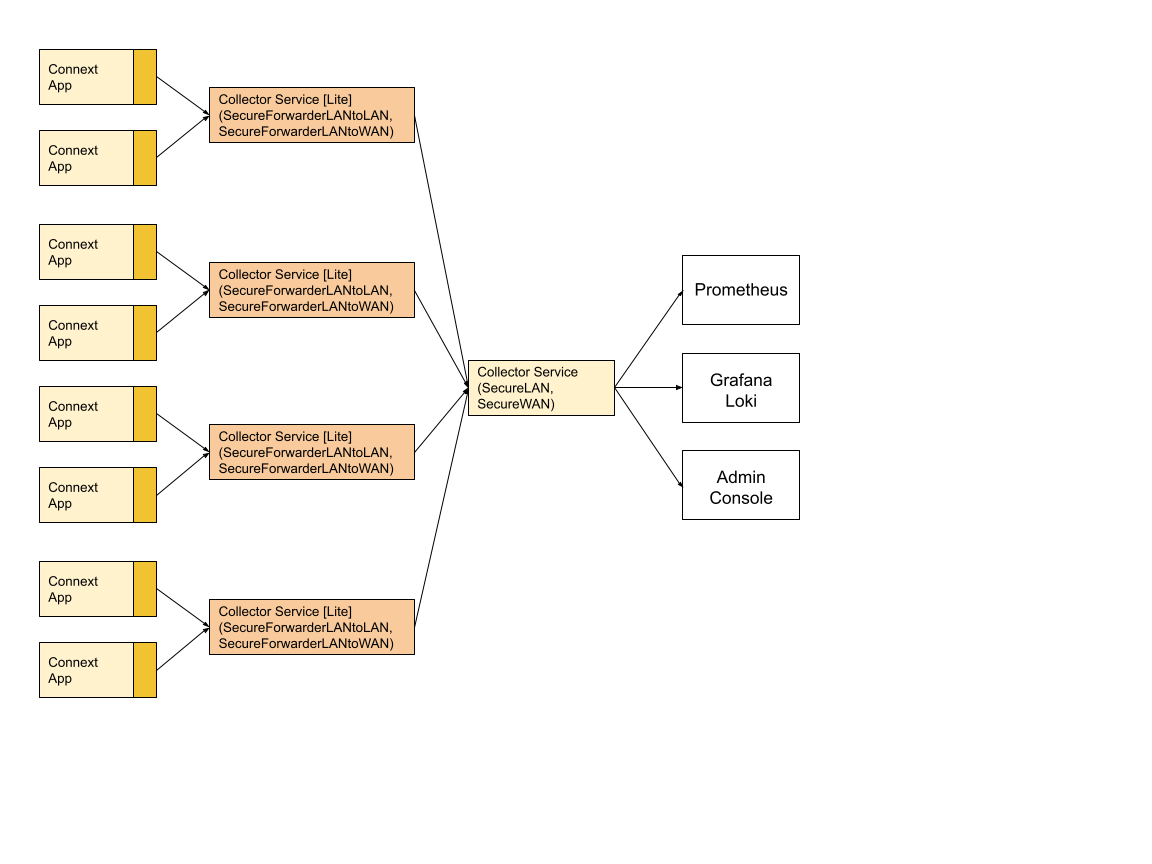
Figure 2.5 Multiple Layers of Collector Service Instances
2.3.4. Multiple layers of Collector Service instances with OpenTelemetry Collector
In this production deployment scenario, the Collector Service on the last layer is configured to forward telemetry data to an OpenTelemetry Collector. This scenario allows for integration with third-party observability backends other than Prometheus and Grafana Loki. The OpenTelemetry Collector can be configured to forward the telemetry data to an OpenTelemetry-compatible backend.
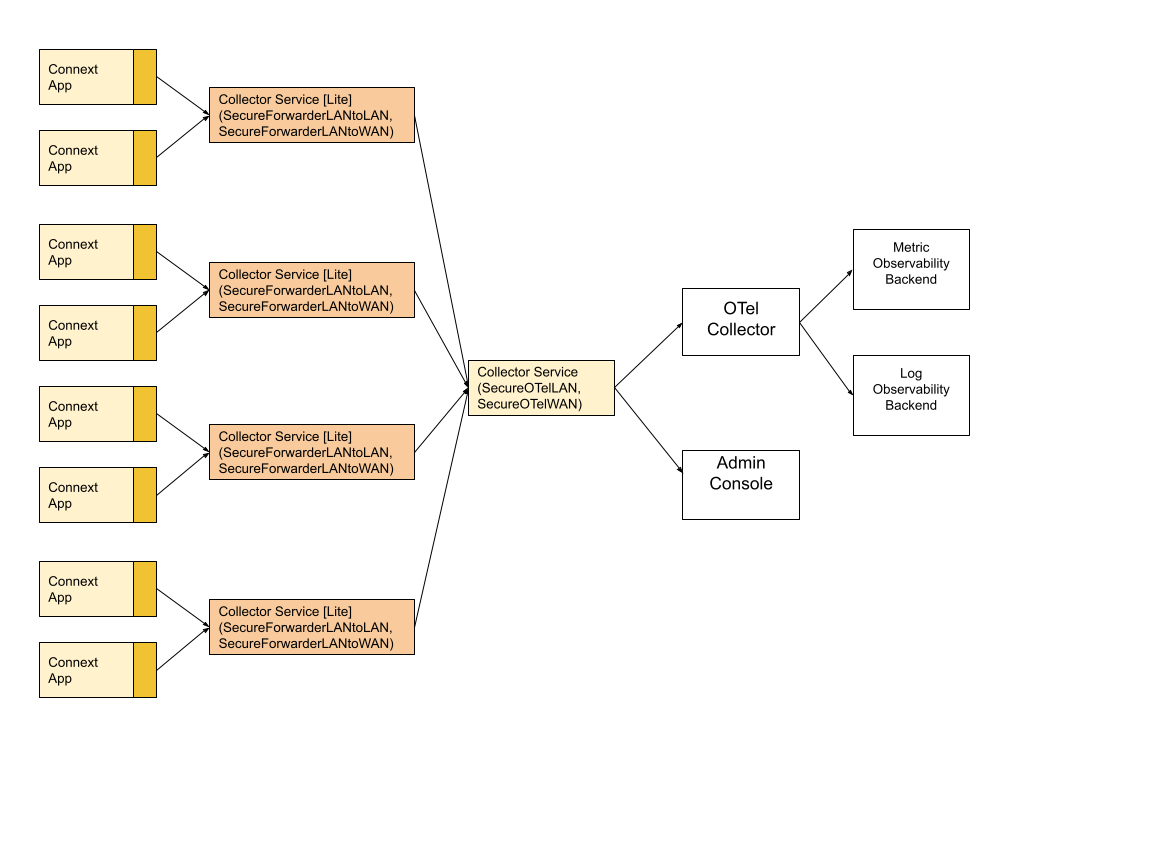
Figure 2.6 Multiple Layers of Collector Service Instances with OpenTelemetry Collector