12.4. Monitoring Distribution Platform
Monitoring refers to the distribution of health status information metrics from instrumented RTI Services. This section describes the architecture of the monitoring capability supported in RTI Routing Service and RTI Recording Service. You will learn what type of information these application can provide and how to access it.
RTI Services provide monitoring information through a Distribution Topic, which is a DDS Topic responsible for distributing information with certain characteristics about the service resources. An RTI Service provides monitoring information through the following three distribution topics:
ConfigDistributionTopic: Distributes metrics related to the description and configuration of a Resource. This information may be immutable or change rarely.
EventDistributionTopic: Distributes metrics related to Resource status notifications of asynchronous nature. This information is provided asynchronously when Resources change after the occurrence of an event.
PeriodicDistributionTopic: Distribute metrics related to periodic, sampling-based updates of a Resource. Information is provided periodically at a configurable publication period.
These three Topics are shared across all services for the distribution of the monitoring information. Table 12.7 provides a summary of these topics.
Topic |
Name |
Top-level Type Name |
|---|---|---|
ConfigDistributionTopic |
rti/service/monitoring/config |
rti::service::monitoring::Config |
EventDistributionTopic |
rti/service/monitoring/event |
rti::service::monitoring::Event |
PeriodicDistributionTopic |
rti/service/monitoring/periodic |
rti::service::monitoring::Periodic |
Figure 12.5 shows the mapping of the monitoring information into the distribution Topics. A distribution Topic is keyed on service resources categorized as keyed Resources. These are resources whose related monitoring information is provided as an instance on the distribution Topic.
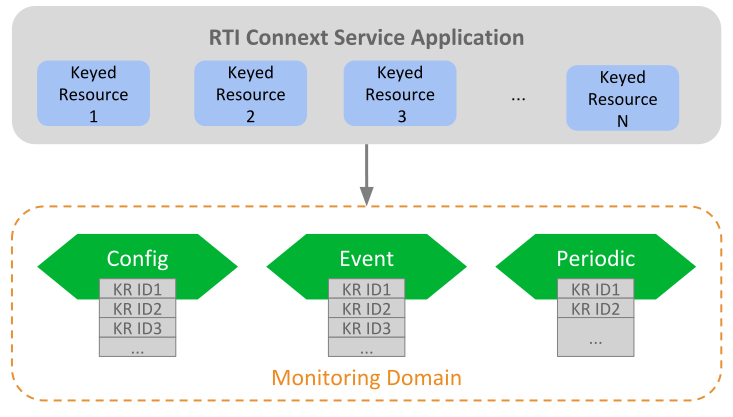
Figure 12.5 Monitoring Distribution Topics of RTI Services
12.4.1. Distribution Topic Definition
All distribution Topics have a common type structure that is composed of two parts: a base type that identifies a resource object and a resource-specific type that contains actual status monitoring information.
The definition of a distribution Topic is shown in Figure 12.6.
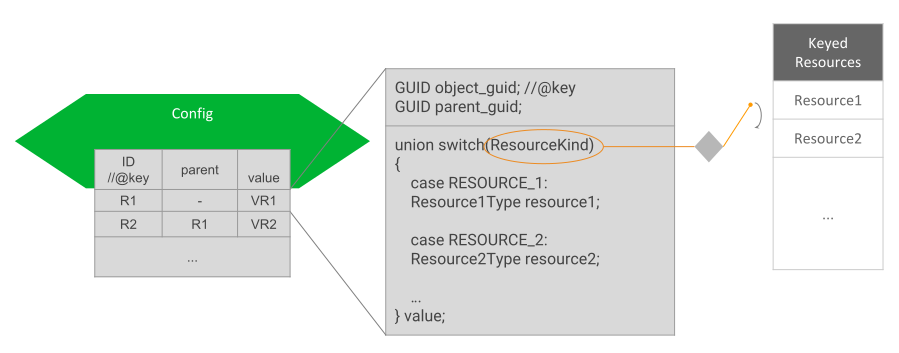
Figure 12.6 Monitoring Distribution Topic Definition
Keyed Resource Base Type Fields
This is the base type of all distribution Topics and consists of two fields:
object_guid: Key field. It represents a 16-byte sequence that uniquely identifies a Keyed Resource across all the available services in the monitoring domain. Hence, the associated instance handle key hash will be the same for all distribution Topics, allowing easy correlation of a resource. It will also facilitate, as we will discuss later, easy instance data manipulation in a DataReader.parent_guid: It contains the object GUID of the parent resource. This field will be set to all zeros if the object is a top-level resource thus with no parent.
This base type, KeyedResource, is defined in
[NDDSHOME]/resource/idl/ServiceCommon.idl.
Resource-Specific Type Fields
This is the type that conveys monitoring information for a concrete resource object. Since a distribution Topic is responsible for providing information about different resource classes, the resource-specific type consists of a single field that is a Union of all the possible representations for the keyed resources that provide that on the topic.
As expected, there must be consistency between the two parts of the distribution topic type. That is, a sample for a concrete resource object must contain the resource-specific union discriminator corresponding to the resource object’s class.
12.4.1.1. Example: Monitoring of Generic Application
Assume a generic application that provides monitoring information about the modes
of transports Car, Boat and Plane. Each mode is mapped to a keyed
resource, each with a custom type that contains metrics specific to each class.
The monitoring distribution Topic top-level type,
TransportModeDistribution, would be defined as follows, using IDL v4 notation:
#include "ServiceCommon.idl"

@nested
struct CarType {
    float speed;
    String color;
    String plate_number;
};

@nested
struct BoatType {
    float knots;
    float latitude;
    float longitude;
};

@nested
struct PlaneType {
    float ground_speed;
    int32 air_track;
};

enum TransportModeKind {
    CAR_TRANSPORT_MODE,
    BOAT_TRANSPORT_MODE,
    PLANE_TRANSPORT_MODE
};

@nested
union TransportModeUnion switch (TransportModeKind) {
    case CAR_TRANSPORT_MODE:
    CarType car;

    case BOAT_TRANSPORT_MODE:
    BoatType boat;

    case PLANE_TRANSPORT_MODE:
    PlaneType plane;
}

struct TransportModeDistribution : KeyedResource {
    TransportModeUnion value;

};
Assume now that in the monitoring domain there are three resource objects, one
for each resource class: a Car object ‘CarA’, a Boat object ‘Boat1’,
and a Plane object ‘PlaneX’. They all have unique resource GUIDs and each
object represents an instance in the distribution Topic. The table shows the
example of potential sample values:
CarA |
Boat1 |
PlaneX |
|
|---|---|---|---|
|
0x0C |
0xAB |
0xf2 |
|
0x00 |
0x00 |
0x00 |
|
CAR_TRANSPORT_MODE |
BOAT_TRANSPORT_MODE |
PLANE_TRANSPORT_MODE |
12.4.2. DDS Entities
RTI Services allow you to distribute monitoring information in any domain. For that, they create the following DDS entities:
A DomainParticipant on the monitoring domain.
A single Publisher for all DataWriters.
A DataWriter for each distribution Topic.
A service will create these entities with default QoS or otherwise the
corresponding service user’s manual will specify the actual values. Services
allow you to customize the QoS of the DDS entities, typically in the
service monitoring configuration under the <monitoring> tag. You will
need to refer to each service’s user’s manual.
12.4.3. Monitoring Metrics Publication
How services publish monitoring samples depends on the distribution Topic.
12.4.3.1. Configuration Distribution Topic
There are two events that cause the publication of samples in this topic:
As soon as a Resource object is created. This event generates the first sample in the Topic for the resource object just created. Since these first samples are published as resources are created, it is guaranteed to be in hierarchical order; that is, the sample for a parent Resource is published before its children. When Resources are created depends on the service. Typically, Resources are created on service startup. Other cases include manual creation (e.g., through remote administration) or external event-driven creation (e.g., discovery of matching streams, in the case of AutoRoute in Routing Service).
On Resource object update. This event occurs when the properties of the object change due to a set or update operation (e.g., through remote administration).
12.4.3.2. Event Distribution Topic
Services publish samples in this Topic in reaction to an internal event, such as a Resource state change. Which events and their associated information and when they occur is highly dependent on concrete service implementations.
12.4.3.3. Periodic Distribution Topic
Samples in this Topic are published periodically, according to a fixed configurable period. The metrics provided in this Topic are generated in two different ways:
As a snapshot of the current value, taken at the publication time (e.g., current number of matching DataReaders). This represents a simple case and the metric is typically represented with an adequate primitive member.
As a statistic variable generated from a set of discreet measurements, obtained periodically. This represents a continous flow of metrics, represented with the
StatisticVariabletype (see Statistic Variable).
There are two activities involved in the generation of the statistic variables:
Calculation and Publication. All the configuration elements for these
activities are available under the <monitoring> tag.
12.4.3.3.1. Calculation
The instrumented service periodically performs measurements
on the metric. This activity is also known as sampling (don’t confuse with
data samples). The frequency of the measurements can be configured with
the tag <statistics_sampling_period>. As a general recommendation, the
sampling period should be a few times smaller than the publication period. A
small sampling period provides more accurate statistics generation at the
expense of increasing memory and CPU consumption.
12.4.3.3.2. Publication
The service periodically publishes a data sample containing a snapshot of
the statistics generated during the calculation phase. The publication period
can be configured with the tag <statistics_publication_period>.The value of
a statistic variable corresponds to the time window of a publication period.
12.4.4. Monitoring Metrics Reference
This section describes the types used as common metrics across services.
All the type definitions listed here are in
[NDDSHOME]/resource/idl/ServiceCommon.idl.
12.4.4.1. Statistic Variable
            @appendable @nested
            struct StatisticMetrics {
                int64 period_ms;
                int64 count;
                float mean;
                float minimum;
                float maximum;
                float std_dev;
            };

            @appendable @nested
            struct StatisticVariable {
                StatisticMetrics publication_period_metrics;
            };
Field Name |
Description |
|---|---|
period_ms |
Period in milliseconds at which the metrics are published. |
count |
Sum of all the measurement values obtained during the publication period. |
mean |
Arithmetic mean of all the measurement values during publication
period. |
min |
Minimum of all the measurement values during publication period. |
max |
Maximum of all the measurement values during publication
period. |
std_dev |
Standard deviation of all the measurement values during publication
period. |
12.4.4.2. Host Metrics
            @appendable @nested
            struct HostPeriodic {
                @optional StatisticVariable cpu_usage_percentage;
                @optional StatisticVariable free_memory_kb;
                @optional StatisticVariable free_swap_memory_kb;
                int32 uptime_sec;
            };

            @appendable @nested
            struct HostConfig {
                BoundedString name;
                uint32 id;
                int64 total_memory_kb;
                int64 total_swap_memory_kb;
                BoundedString target;
            };
Field Name |
Description |
|---|---|
name |
Name of the host where the service is running. |
id |
ID of the host where the service is running. |
total_memory_kb |
Total memory in KiloBytes of the host where the service is running. |
total_swap_memory_kb |
Total swap memory in KiloBytes of the host where the service is
running. |
Field Name |
Description |
|---|---|
cpu_usage_percentage |
Statistic variable that provides the global percentage of CPU usage on
the host where the service is running. |
free_memory_kb |
Statistic variable that provides the amount of free memory in
KiloBytes of the host where the service is running. |
free_wap_memory_kb |
Statistic variable that provides the amount of free swap memory in
KiloBytes of the host where the service is running. |
uptime_sec |
Time in seconds elapsed since the host on which the running service
started. |
12.4.4.3. Process Metrics
            @appendable @nested
            struct ProcessConfig {
                uint64 id;
            };
            @mutable @nested
            struct ProcessPeriodic {
                @optional StatisticVariable cpu_usage_percentage;
                @optional StatisticVariable physical_memory_kb;
                @optional StatisticVariable total_memory_kb;
                int32 uptime_sec;
            };
Field Name |
Description |
|---|---|
id |
Identifies the process where the service is running. The meaning of this value is platform dependent. |
Field Name |
Description |
|---|---|
cpu_usage_percentage |
Statistic variable that provides the percentage of CPU usage of
the process where the service is running. |
physical_memory_kb |
Statistic variable that provides the physical memory utilization in
KiloBytes of the process where the service is running. |
total_memory_kb |
Statistic variable that provides the virtual memory utilization in
KiloBytes of the process where the service is running. |
uptime_sec |
Time in seconds elapsed since the running service process started. |
12.4.4.4. Base Entity Resource Metrics
            @mutable @nested
            struct EntityConfig {
                ResourceId resource_id;
                XmlString configuration;
            };
            @mutable @nested
            struct EntityEvent{
                EntityStateKind state;
            };
Field Name |
Description |
|---|---|
resource_id |
String representation of the resource identifier associated with the entity resource. |
configuration |
String representation of the XML configuration of the entity resource. The XML contains only children elements that are not entity resources. |
Field Name |
Description |
|---|---|
state |
State of the resource entity expressed as an enumeration of
type |
12.4.4.5. Network Performance Metrics
            @appendable @nested
            struct NetworkPerformance {
                @optional StatisticVariable samples_per_sec;
                @optional StatisticVariable bytes_per_sec;
                @optional StatisticVariable latency_millisec;
            };
Field Name |
Description |
|---|---|
samples_per_sec |
Statistic variable that provides information about the number of samples processed (received or sent) per second. |
bytes_per_sec |
Statistic variable that provides information about the number of bytes processed (received or sent) per second. |
latency_millisec |
Statistic variable that provides information about the latency in
milliseconds for the data processed. |
12.4.4.6. Thread Metrics
            @mutable @nested
            struct ThreadPeriodic {
                uint64 id;
                @optional StatisticVariable cpu_usage_percentage;
            };

            @mutable @nested
            struct ThreadPoolPeriodic {
                @optional sequence<Service::Monitoring::ThreadPeriodic> threads;
            };
Field Name |
Description |
|---|---|
id |
OS-assigned thread identifier |
cpu_usage_percentage |
Statistic variable that provides the percentage of CPU usage of
the thread belonging to the process where the service is running. |