2.2.5. Step 5: Recording Service
In this step, we will look at the Recording Service interface. Click on the Recording Service node in the Physical View or in the Processes View. There are a number of tabs, but we will just review Recording Entities and Recording Configuration.
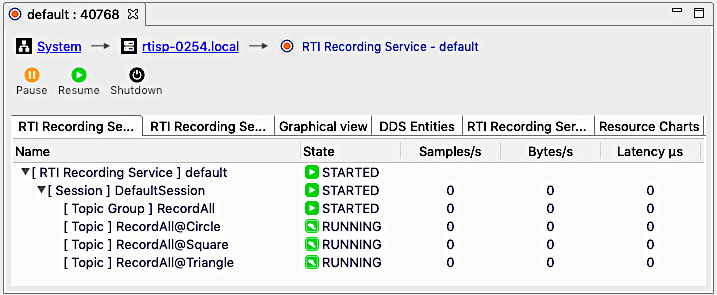
2.2.5.1. Recording Entities
This view contains a tree view with five columns that display the name, state, throughput in samples per second, throughput in bytes per second, and latency data for the service’s entities.
Press the pause button in the toolbar.
Entities labeled “[ Topic ]” transition their states from running to paused.
Press the resume button, and the states transition back to running.
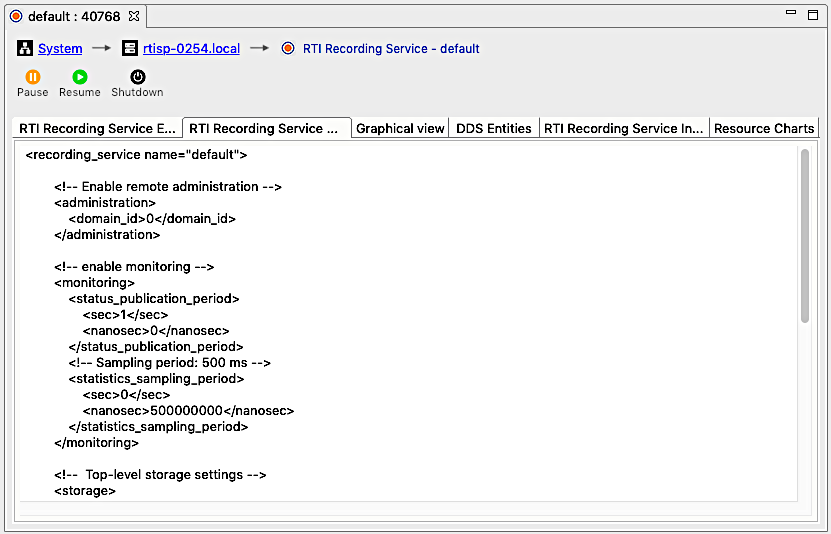
2.2.5.2. Recording Configuration
This view contains a display of the service’s configuration. Unlike the Routing Service configuration display, this one contains the entire contents of the configuration. It may be possible to copy the text from this configuration and use it in a new configuration file; however, some limitations may exist, such as references to QoS profiles not contained in the original file.
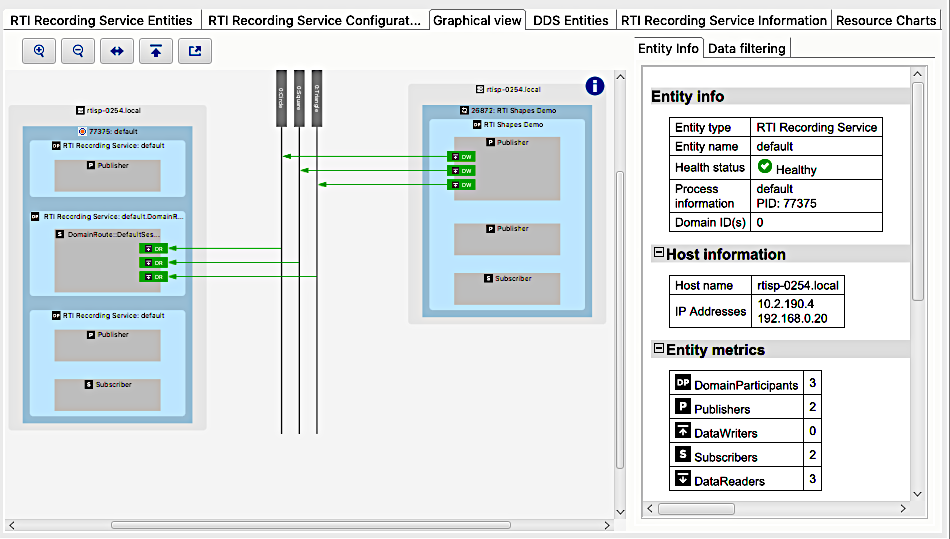
2.2.5.3. Graphical View
The Graphical View tab will show the Process View for a specific Recording Service Process.
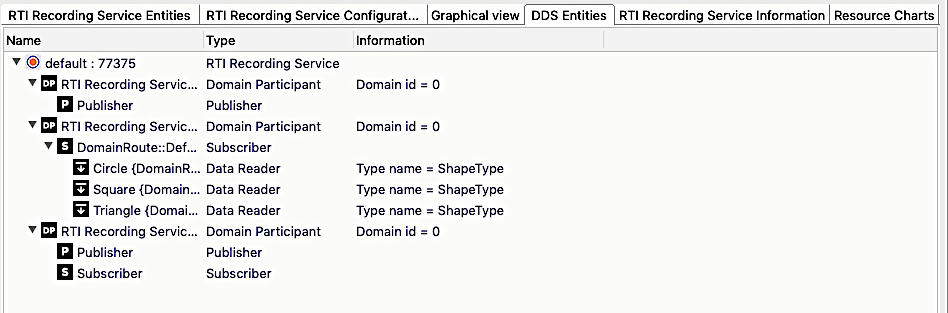
2.2.5.4. DDS Entities
The DDS Entities Tab will provide information about all the entities that are child entities of the current Recording Service.
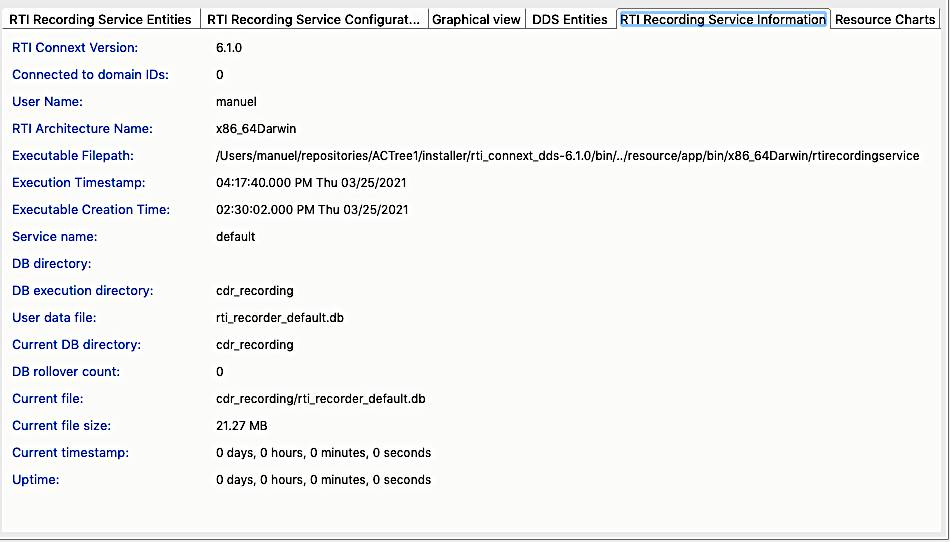
2.2.5.5. RTI Recording Service Information
The RTI Recording Service information will show specific information about the RTI Recording Service Process, such as the Connext version, the domains to which it is connected, creation time or database information where data is being stored.
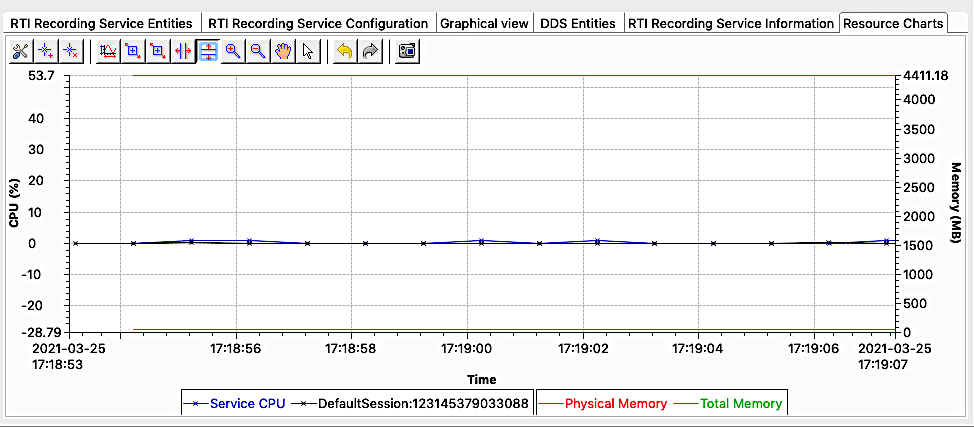
2.2.5.6. Resource Charts
The Resource Charts tab shows the CPU and memory consumption of the service over time.