Performance Benchmarking#
Introduction#
What you’ll learn
This module introduces RTI’s Network Performance tool (RTI Perftest) to measure the minimum latency and maximum average throughput that two Connext applications can achieve in your network.
You will do the following:
Run RTI Perftest on two machines to measure the performance of two Connext applications communicating over UDP
Optionally, run a test using raw sockets (without Connext) to obtain a baseline
Analyze the results and compare them with RTI’s official benchmarks
Perftest is a tool that allows measuring Connext’s latency and throughput between two or more nodes. You’ll run Perftest in two nodes, as illustrated below.
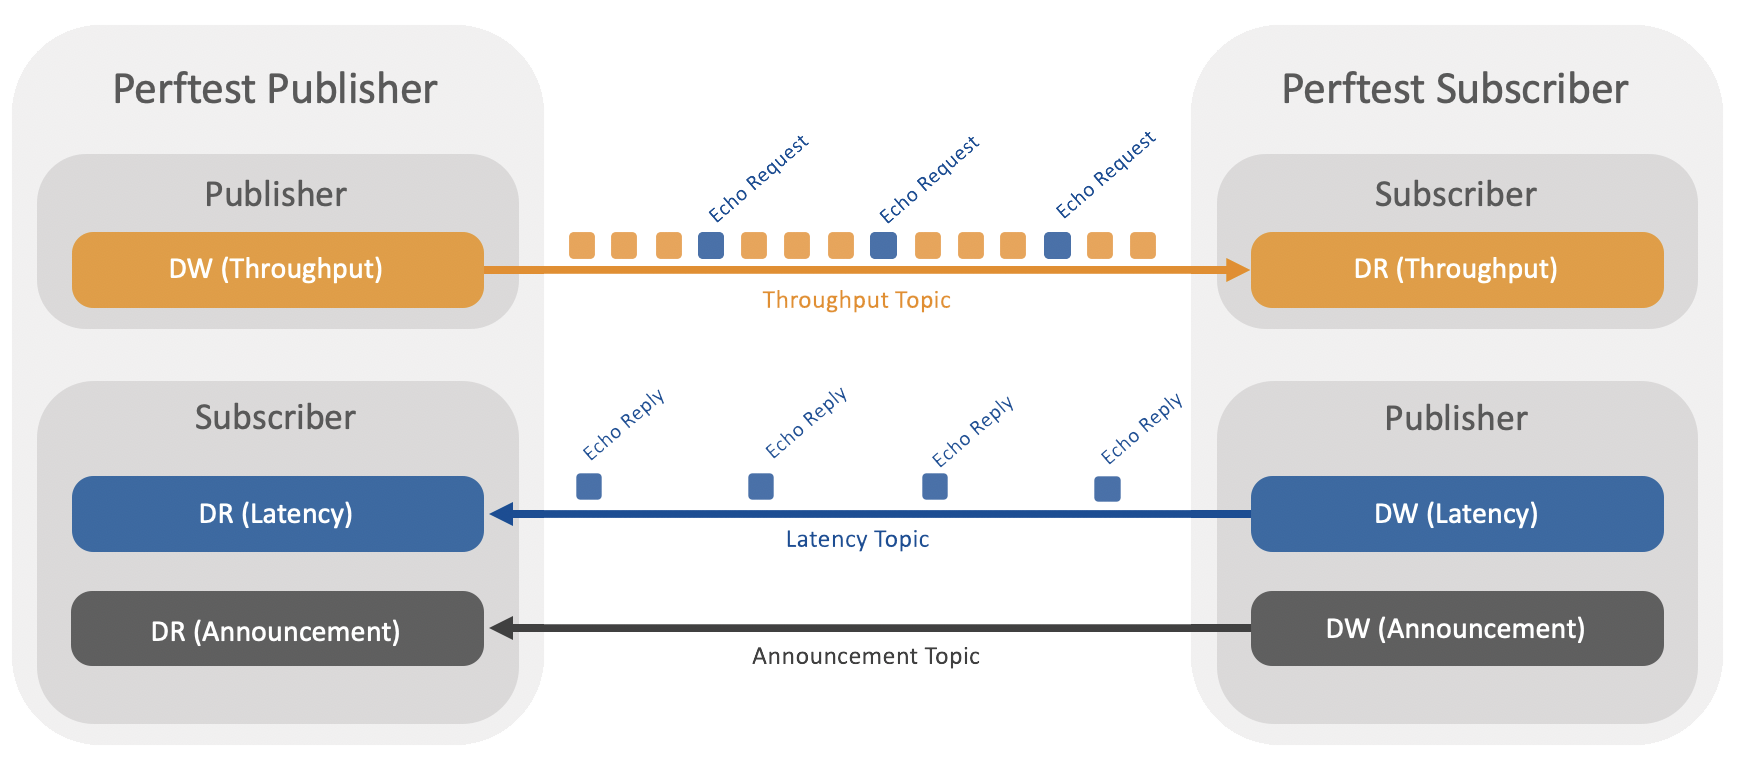
Perftest works in two modes:
Throughput test. In this mode, one node (Perftest Publisher) publishes data samples for a Topic as fast as possible, while the other node (Perftest Subscriber) measures the number of data samples per second it receives.
Latency test. In this mode, the two nodes perform a ping-pong test, where one sends a data sample (echo request) and the other one sends it back (echo reply). Perftest calculates the latency as half of the round-trip time. This process is repeated several times to calculate the average, several percentiles, and the standard deviation (jitter).
This information helps you determine if you can meet your scenario’s performance requirements.
For example, if your system requires a latency of 5 microseconds under heavy load and the minimum average latency you obtained is 10 microseconds, you may not be able to meet the requirements. On the other hand, if your throughput requirements are 1000 samples per second and Perftest measures 1 million samples per second, you can expect your system to meet the requirements under a reasonable load.
How to complete this module#
To complete this module you’ll need the following:
30-40 minutes.
Two machines (we will use two Linux boards connected to the same network for this module).
Access (physical or remote) to the two machines.
1. Download Perftest#
On both machines, download Perftest from the RTI Perftest GitHub repository
and extract it into a directory of your choice (referred to here as <perftest home>). This package contains
the application binary under bin/<platform>/perftest_cpp and a perftest_qos_profiles.xml file with the QoS profiles used by
the application.
Perftest is also available as source code and as a Docker image.
Alternative ways to get Perftest
You can get the source code from the RTI Perftest GitHub repository:
git clone https://github.com/rticommunity/rtiperftest.git
To compile it, you’ll need a Connext installation (see Get Started).
Run the following command to build the executable under ./bin/<platform>
(replace x64Linux4gcc8.5.0 with your platform if it is different):
cd rtiperftest
./build.sh --platform x64Linux4gcc8.5.0 --cpp-build --nddshome <Connext installation directory>
You can run Perftest by using the RTI Perftest container image.
docker run --network host \
    -v $PATH_TO_RTI_LICENSE_FILE:/opt/rti.com/rti_connext_dds-<version>/rti_license.dat \
    rticom/perftest <perftest command line options here>
Note that running Perftest from Docker will slightly impact the performance results.
2. Run the throughput test#
First, let’s run a short test to verify communication between both machines.
From the <perftest home> directory, open a terminal on each machine.
Run the following command on Machine 1, the publisher:
$ ./bin/x64Linux4gcc8.5.0/perftest_cpp -pub -executionTime 5
(Replace x64Linux4gcc8.5.0 with your platform name if it is different)
Run the following command on Machine 2, the subscriber:
$ ./bin/x64Linux4gcc8.5.0/perftest_cpp
If everything is correct, the output will be similar to the following. Notice that the latency information is presented on the publisher side, while the throughput information is presented on the subscriber side.
$ ./bin/x64Linux4gcc8.5.0/release/perftest_cpp -pub -executionTime 5
RTI Perftest release/<version> (RTI Connext DDS <version>)

Mode: THROUGHPUT TEST
    (Use "-latencyTest" for Latency Mode)

Perftest Configuration:
        Reliability: Reliable
        Keyed: No
        Publisher ID: 0
        Latency count: 1 latency sample every 10000 samples
        Data Size: 100
        Batching: 8192 Bytes (Use "-batchSize 0" to disable batching)
        Publication Rate: Unlimited (Not set)
        Execution time: 5 seconds
        Receive using: Listeners
        Domain: 1
        Dynamic Data: No
        CRC Enabled: No
        Message Length Header Extension Enabled: No
        FlatData: No
        Zero Copy: No
        Asynchronous Publishing: No
        XML File: perftest_qos_profiles.xml
        Network capture: No

Transport Configuration:
        Kind: UDPv4 & SHMEM (taken from QoS XML file)
        Use Multicast: False
        SHMEM message_size_max: 65536
        SHMEM received_message_count_max: 102
        SHMEM receive_buffer_size: 6684672

Waiting to discover 1 subscribers ...
Waiting for subscribers announcement ...
Sending 4050 initialization pings ...
Sending data ...

Intervals One-Way Latency for 100 Bytes:
Length (Bytes), Latency (μs), Ave (μs), Std (μs), Min (μs), Max (μs)
           100,           96,      118,     21.5,       96,      139
           100,           85,      107,     23.3,       85,      139
           100,           85,      101,     22.3,       85,      139
           100,           63,       94,     25.1,       63,      139
           100,           64,       89,     25.4,       63,      139
           100,          123,       94,     26.4,       63,      139
           100,           74,       91,     25.6,       63,      139

One-way Latency Summary:
Sample Size (Bytes), Ave (μs), Std (μs), Min (μs), Max (μs), 50% (μs), 90% (μs), 99% (μs), 99.99% (μs), 99.9999% (μs)
                100,       91,     25.6,       63,      139,       85,      139,      139,         139,           139
Finishing test due to timer...
Test ended.
$ ./bin/x64Linux4gcc8.5.0/release/perftest_cpp -sub
RTI Perftest release/<version> (RTI Connext DDS <version>)

Perftest Configuration:
        Reliability: Reliable
        Keyed: No
        Subscriber ID: 0
        Data Size: 100
        Receive using: Listeners
        Domain: 1
        Dynamic Data: No
        CRC Enabled: No
        Message Length Header Extension Enabled: No
        FlatData: No
        Zero Copy: No
        XML File: perftest_qos_profiles.xml
        Network capture: No

Transport Configuration:
        Kind: UDPv4 & SHMEM (taken from QoS XML file)
        Use Multicast: False
        SHMEM message_size_max: 65536
        SHMEM received_message_count_max: 102
        SHMEM receive_buffer_size: 6684672

Waiting to discover 1 publishers ...

Interval Throughput for 100 Bytes:
Length (Bytes), Total Samples,  Samples/s, Avg Samples/s,     Mbps,  Avg Mbps, Lost Samples, Lost Samples (%)
Waiting for data ...
           100,       3067713,    1136283,       1136283,    909.0,     909.0,            0,             0.00
           100,       4207140,    1139347,       1137815,    911.5,     910.3,            0,             0.00
           100,       5343813,    1136600,       1137410,    909.3,     909.9,            0,             0.00

Throughput Summary:
Sample Size (Bytes), Total Samples, Avg Samples/s,    Avg Mbps, Lost Samples, Lost Samples (%)
                100,       5692924,       1138580,       910.9,            0,             0.00
Finishing test...
Test ended.
Next, we’ll run a longer test. Usually 30-60 seconds is enough time to reach a steady state.
Run the following command on Machine 1, the publisher:
$ ./bin/x64Linux4gcc8.5.0/perftest_cpp \
        -pub \
        -datalen 256 \
        -executionTime 30 \
        -noPrint \
        -nic eth0
Replace the -nic option with the name of your network interface. Specifying
this option prevents Perftest from communicating over multiple interfaces.
Run the following command on Machine 2, the subscriber:
$ ./bin/x64Linux4gcc8.5.0/perftest_cpp \
        -datalen 256 \
        -noPrint \
        -nic eth0
The throughput results are displayed on the subscriber side. At the end, you’ll see a summary like the following:
...
Throughput Summary:
Sample Size (Bytes), Total Samples, Avg Samples/s,    Avg Mbps, Lost Samples, Lost Samples (%)
                256,      13956672,        465183,       952.7,            0,             0.00
Finishing test...
Test ended.
In a throughput test, Perftest enables the batching QoS policy by default. With batching enabled, writers send
multiple data samples in a single network package. This is a good feature to enable in a throughput test;
to also test without batching, pass the -batchSize 0 command-line option.
This test measured throughput for a Topic in which each data sample was 256 bytes long. You can do further testing using a data size closer to your use case, or you can repeat the test for several data sizes.
Run the throughput test for different data sizes (optional)
The following bash scripts run the tests for different data sizes.
Replace PLATFORM and IF_PUBLISHER_SIDE (network interface) with the values
for your machines.
#!/bin/bash

# Set the value for these variables before running the test
PERFTEST_HOME="."
PLATFORM="x64Linux4gcc8.5.0"
IF_PUBLISHER_SIDE="eth0"

DATA_SIZES=(64 256 512 1024 4096 8192 16384 32768 63000)
DOMAIN=0
OUTPUT_FILE="./throughput_pub_results.csv"
EXTRA_PARAMS=""
touch $OUTPUT_FILE
for SIZE in "${DATA_SIZES[@]}"; do
    $PERFTEST_HOME/bin/$PLATFORM/perftest_cpp -pub \
        -datalen ${SIZE} ${EXTRA_PARAMS} \
        -domain ${DOMAIN} \
        -executionTime 30 \
        -noPrint \
        -nic ${IF_PUBLISHER_SIDE} >> ${OUTPUT_FILE}
        # Optional: -batchSize 0 to disable batching
    DOMAIN=$((DOMAIN+1))
    EXTRA_PARAMS="-noOutputHeaders"
done
Replace PLATFORM and IF_SUBSCRIBER_SIDE (network interface) with the values
for your machines.
#!/bin/bash

# Set the value for these variables before running the test
PERFTEST_HOME="."
PLATFORM="x64Linux4gcc8.5.0"
IF_SUBSCRIBER_SIDE="eth0"

DATA_SIZES=(64 256 512 1024 4096 8192 16384 32768 63000)
DOMAIN=0
OUTPUT_FILE="./throughput_sub_results.csv"
EXTRA_PARAMS=""
touch $OUTPUT_FILE
for SIZE in "${DATA_SIZES[@]}"; do
    $PERFTEST_HOME/bin/$PLATFORM/perftest_cpp \
        -datalen ${SIZE} ${EXTRA_PARAMS} \
        -domain ${DOMAIN} \
        -noPrint \
        -nic ${IF_SUBSCRIBER_SIDE} >> ${OUTPUT_FILE}
    DOMAIN=$((DOMAIN+1))
    EXTRA_PARAMS="-noOutputHeaders"
done
Perftest command-line options
Option |
Description |
|---|---|
|
The size of the sample in bytes. The default is |
|
The domain to use for the test. |
|
In a throughput test, Perftest uses batching by default to get the
best possible performance. To disable batching, set the value to |
|
When present, a latency test is run; otherwise it’s a throughput test, which is the default. |
|
The network interface to use; the value must be the interface name or IP address. If not present, Connext uses all available interfaces; for best results, specify the interface you plan to test with. |
|
The transport to use ( |
|
If present, only the final summary displays. For latency tests, use this option on the publisher side to avoid printing all the samples, which could cause overhead. |
|
The time in seconds that the test will run. |
|
If present, the test will use raw UDP sockets instead of Connext. |
|
The IP address of the machine hosting the related application. |
3. Run the Latency Test#
We’ll now run the latency test.
Run the following command on Machine 1, the publisher:
$ ./bin/x64Linux4gcc8.5.0/perftest_cpp \
        -pub \
        -latencyTest \
        -datalen 256 \
        -executionTime 30 \
        -noPrint \
        -nic eth0
Run the following command on Machine 2, the subscriber:
$ ./bin/x64Linux4gcc8.5.0/perftest_cpp \
        -datalen 256 \
        -noPrint \
        -nic eth0
The latency results are displayed on the publisher side. At the end, you’ll see a summary like the following:
...
One-way Latency Summary:
Sample Size (Bytes), Ave (μs), Std (μs), Min (μs), Max (μs), 50% (μs), 90% (μs), 99% (μs), 99.99% (μs), 99.9999% (μs)
                256,      135,     10.1,       83,      180,      137,      145,      148,         170,           180
Finishing test due to timer...
Test ended.
You can now run the latency test for different data sizes.
Run the latency test for different data sizes (optional)
The following bash scripts run the tests for different data sizes.
Replace PLATFORM and IF_PUBLISHER_SIDE (network interface) with the values
for your machines.
#!/bin/bash

# Set the value for these variables before running the test
PERFTEST_HOME="."
PLATFORM="x64Linux4gcc8.5.0"
IF_PUBLISHER_SIDE="eth0"

DATA_SIZES=(64 256 512 1024 4096 8192 16384 32768 63000)
DOMAIN=0
OUTPUT_FILE="./latency_pub_results.csv"
EXTRA_PARAMS=""
touch $OUTPUT_FILE
for SIZE in "${DATA_SIZES[@]}"; do
    $PERFTEST_HOME/bin/$PLATFORM/perftest_cpp -pub \
        -latencyTest \
        -datalen ${SIZE} ${EXTRA_PARAMS} \
        -domain ${DOMAIN} \
        -executionTime 30 \
        -noPrint \
        -nic ${IF_PUBLISHER_SIDE} >> ${OUTPUT_FILE}
    DOMAIN=$((DOMAIN+1))
    EXTRA_PARAMS="-noOutputHeaders"
done
Replace PLATFORM and IF_SUBSCRIBER_SIDE (network interface) with the values
for your machines.
#!/bin/bash

# Set the value for these variables before running the test
PERFTEST_HOME="."
PLATFORM="x64Linux4gcc8.5.0"
IF_SUBSCRIBER_SIDE="eth0"

DATA_SIZES=(64 256 512 1024 4096 8192 16384 32768 63000)
DOMAIN=0
OUTPUT_FILE="./latency_sub_results.csv"
EXTRA_PARAMS=""
touch $OUTPUT_FILE
for SIZE in "${DATA_SIZES[@]}"; do
    $PERFTEST_HOME/bin/$PLATFORM/perftest_cpp \
        -datalen ${SIZE} ${EXTRA_PARAMS} \
        -domain ${DOMAIN} \
        -noPrint \
        -nic ${IF_SUBSCRIBER_SIDE} >> ${OUTPUT_FILE}
    DOMAIN=$((DOMAIN+1))
    EXTRA_PARAMS="-noOutputHeaders"
done
Optional: Run raw UDP socket tests#
In this optional section, we’ll measure the throughput and latency of the raw UDP transport to discern any overhead introduced by Connext. Perftest will still serialize the data, but it will send it directly using a UDP socket.
Run the tests with raw UDP sockets (optional)
To run the the raw UDP test, add the command-line options -rawTransport and
-peer <ip address>. Note that the IP address wasn’t required before,
thanks to Connext’s automatic discovery over multicast.
The following test scripts are the same as those used for the latency and throughput tests, but adapted to use the raw UDP transport.
Throughput test
#!/bin/bash

# Set the value for these variables before running the test
PERFTEST_HOME="."
PLATFORM="x64Linux4gcc8.5.0"
IF_PUBLISHER_SIDE="<interface_publisher_side>"
IP_SUBSCRIBER="X.Y.Z.W"

DATA_SIZES=(64 256 512 1024 4096 8192 16384 32768 63000)
DOMAIN=0
OUTPUT_FILE="./raw_UDP_throughput_pub_results.csv"
EXTRA_PARAMS=""
touch $OUTPUT_FILE
for SIZE in "${DATA_SIZES[@]}"; do
    $PERFTEST_HOME/bin/$PLATFORM/perftest_cpp -pub \
        -rawTransport \
        -datalen ${SIZE} ${EXTRA_PARAMS} \
        -domain ${DOMAIN} \
        -executionTime 30 \
        -noPrint \
        -nic ${IF_PUBLISHER_SIDE} \
        -peer ${IP_SUBSCRIBER} >> ${OUTPUT_FILE}
        # Optional: -batchSize 0 to disable batching
    DOMAIN=$((DOMAIN+1))
    EXTRA_PARAMS="-noOutputHeaders"
done
#!/bin/bash

# Set the value for these variables before running the test
PERFTEST_HOME="."
PLATFORM="x64Linux4gcc8.5.0"
IF_SUBSCRIBER_SIDE="<interface_subscriber_side>"
IP_PUBLISHER="X.Y.Z.W"

DATA_SIZES=(64 256 512 1024 4096 8192 16384 32768 63000)
DOMAIN=0
OUTPUT_FILE="./raw_UDP_throughput_sub_results.csv"
EXTRA_PARAMS=""
touch $OUTPUT_FILE
for SIZE in "${data_sizes[@]}"; do
    $PERFTEST_HOME/bin/$PLATFORM/perftest_cpp \
        -rawTransport \
        -datalen ${SIZE} ${EXTRA_PARAMS} \
        -domain ${DOMAIN} \
        -noPrint \
        -nic ${IF_SUBSCRIBER_SIDE} \
        -peer ${IP_PUBLISHER} >> ${OUTPUT_FILE}
    DOMAIN=$((DOMAIN+1))
    EXTRA_PARAMS="-noOutputHeaders"
done
Latency test
#!/bin/bash

# Set the value for these variables before running the test
PERFTEST_HOME="."
PLATFORM="x64Linux4gcc8.5.0"
IF_PUBLISHER_SIDE="<interface_publisher_side>"
IP_SUBSCRIBER="X.Y.Z.W"

DATA_SIZES=(64 256 512 1024 4096 8192 16384 32768 63000)
DOMAIN=0
OUTPUT_FILE="./raw_UDP_latency_pub_results.csv"
EXTRA_PARAMS=""
touch $OUTPUT_FILE
for SIZE in "${DATA_SIZES[@]}"; do
    $PERFTEST_HOME/bin/$PLATFORM/perftest_cpp -pub \
        -rawTransport \
        -latencyTest \
        -datalen ${SIZE} ${EXTRA_PARAMS} \
        -domain ${DOMAIN} \
        -executionTime 30 \
        -noPrint \
        -nic ${IF_PUBLISHER_SIDE} \
        -peer ${IP_SUBSCRIBER} >> ${OUTPUT_FILE}
    DOMAIN=$((DOMAIN+1))
    EXTRA_PARAMS="-noOutputHeaders"
done
#!/bin/bash

# Set the value for these variables before running the test
PERFTEST_HOME="."
PLATFORM="x64Linux4gcc8.5.0"
IF_SUBSCRIBER_SIDE="<interface_subscriber_side>"
IP_PUBLISHER="X.Y.Z.W"

DATA_SIZES=(64 256 512 1024 4096 8192 16384 32768 63000)
DOMAIN=0
OUTPUT_FILE="./raw_UDP_latency_sub_results.csv"
EXTRA_PARAMS=""
touch $OUTPUT_FILE
for SIZE in "${data_sizes[@]}"; do
    $PERFTEST_HOME/bin/$PLATFORM/perftest_cpp \
        -rawTransport \
        -datalen ${SIZE} ${EXTRA_PARAMS} \
        -domain ${DOMAIN} \
        -noPrint \
        -nic ${IF_SUBSCRIBER_SIDE} \
        -peer ${IP_PUBLISHER} >> ${OUTPUT_FILE}
    DOMAIN=$((DOMAIN+1))
    EXTRA_PARAMS="-noOutputHeaders"
done
4. Analyze the results#
By executing the Perftest latency and throughput tests for different data sizes and saving the output results, you’ll create two tables (in CSV format) with the results of each test (one for the publisher with the latency information and another for the subscriber with the throughput information). This is what we did automatically with the scripts above.
Now you can plot the throughput and latency results per data size using, for example, a spreadsheet application:
In this graph we can see the throughput of the system for different data sizes. We are plotting the “Average Mbps” field:
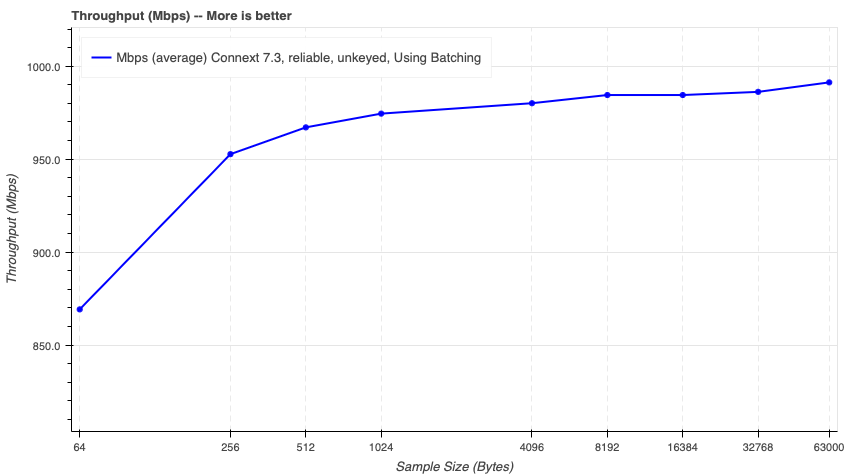
We can see that the throughput increases with the size of the sample, but at some point it reaches a plateau. This plateau is due to the saturation of the network (in this specific case 1Gbps). This means that Connext is able to use approximately 99% of the effective (real) network bandwidth.
Connext Throughput Test, subscriber-side CSV table
Sample Size (Bytes)
Total Samples
Avg Samples/s
Avg Mbps
Lost Samples
Lost Samples (%)
64
50934273
1697636
869.2
0
0.00
256
13956672
465183
952.7
0
0.00
512
7083793
236107
967.1
0
0.00
1024
3568913
118952
974.5
0
0.00
4096
897349
29908
980.1
0
0.00
8192
450701
15021
984.5
0
0.00
16384
223091
7435
974.5
0
0.00
32768
111745
3723
976.2
0
0.00
63000
58423
1947
981.3
0
0.00
In this graph we can see the latency of the system for different data sizes. In this case we plot 3 fields: the Median Latency (solid line), the minimum latency (dashed line), and 90-percentile latency (dashed line):
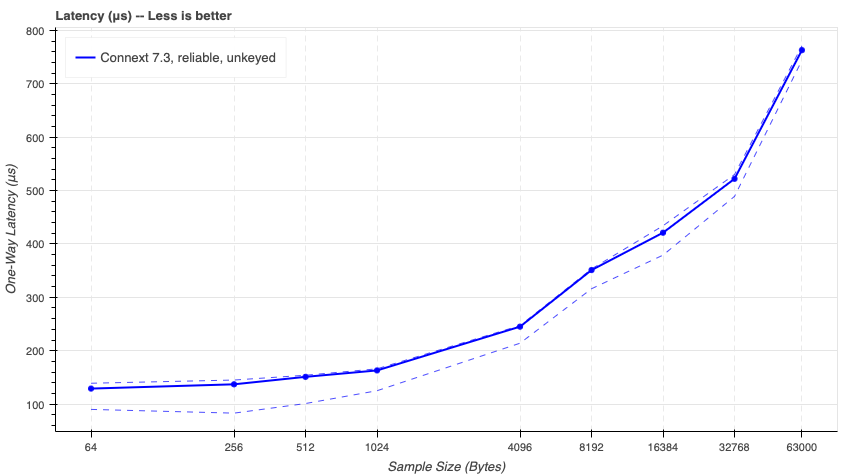
We can observe that the latency
increases with the size of the sample. This increment is due to the serialization time of the sample, plus the time
that it takes for the send() operation to send a bigger packet at the network level (IP and physical layers).
Connext Latency Test, publisher side CSV table
Sample Size (Bytes)
Ave (μs)
Std (μs)
Min (μs)
Max (μs)
50% (μs)
90% (μs)
99% (μs)
99.99% (μs)
99.9999% (μs)
64
129
6.8
90
193
129
139
143
160
193
256
135
10.1
83
180
137
145
148
170
180
512
150
6.3
101
202
151
154
157
183
202
1024
160
7.1
125
212
163
166
171
181
212
4096
245
3.4
214
288
245
247
251
265
288
8192
351
3.3
316
397
351
353
356
371
397
16384
423
8.7
379
477
421
434
437
451
477
32768
522
7.3
489
598
522
530
539
572
598
63000
765
5.9
744
898
763
771
787
859
898
You can compare these results with our official benchmarks to see the differences between your system and the official test results. The CPU and memory of your machines, in conjunction with the bandwidth of your network, are the main factors that will make these graphs differentiate.
If you ran the raw UDP tests, you can also compare them with the Connext results.
Comparing Connext to UDP (optional)
It might be interesting and non-trivial to compare the throughput of Connext with raw UDP:
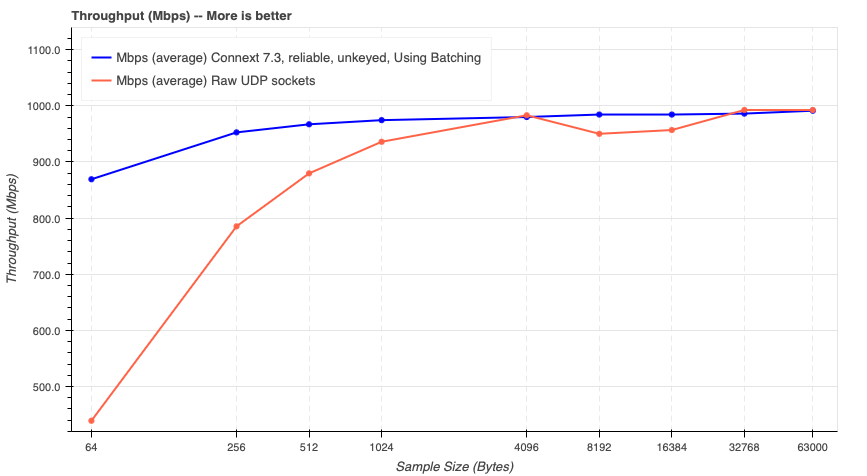
Remember that Connext uses UDP underneath, so intuitively the throughput should be similar or lower, due to the extra overhead that Connext introduces by adding reliability, discovery, and so on. However, you can see in this case how Connext is able to use the network more efficiently thanks to the batching feature.
This is one of the examples where you can see the benefits of using Connext’s features that go beyond using it as a simple network transport.
Connext Throughput Test, subscriber-side CSV table
Sample Size (Bytes)
Total Samples
Avg Samples/s
Avg Mbps
Lost Samples
Lost Samples (%)
64
50934273
1697636
869.2
0
0.00
256
13956672
465183
952.7
0
0.00
512
7083793
236107
967.1
0
0.00
1024
3568913
118952
974.5
0
0.00
4096
897349
29908
980.1
0
0.00
8192
450701
15021
984.5
0
0.00
16384
223091
7435
974.5
0
0.00
32768
111745
3723
976.2
0
0.00
63000
58423
1947
981.3
0
0.00
Raw UDP Throughput Test, subscriber-side CSV table
Sample Size (Bytes)
Total Samples
Avg Samples/s
Avg Mbps
Lost Samples
Lost Samples (%)
64
25725201
857495
439.0
2259406
8.07
256
11503270
383436
785.3
0
0.00
512
6443533
214778
879.7
0
0.00
1024
3427909
114260
936.0
0
0.00
4096
900160
30004
983.2
0
0.00
8192
434991
14499
950.2
0
0.00
16384
219021
7300
956.9
0
0.00
32768
113602
3786
992.6
0
0.00
63000
59080
1969
992.5
0
0.00
Now let’s compare the latency of Connext with raw UDP:
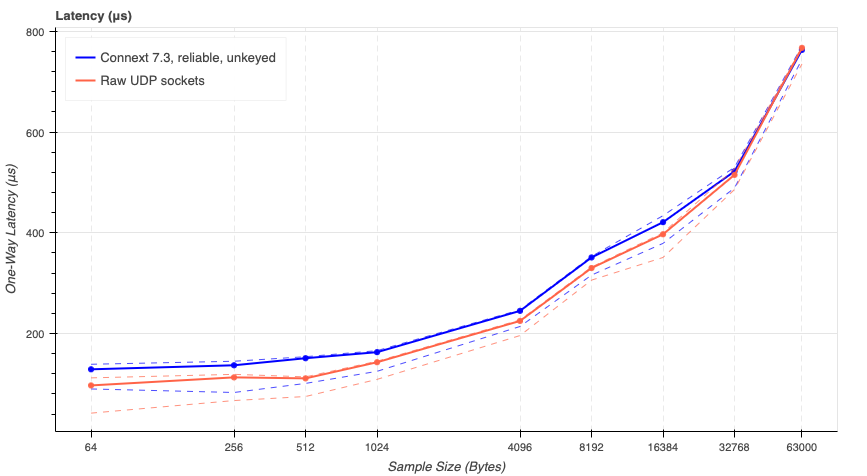
In this case we can see that the latency of Connext is higher than the raw UDP latency. This is expected since the middleware logic adds some latency.
Notice how the difference in performance remains constant, and even less relevant, for larger data sizes. This means that other than the serialization and the sending operation (which happen for both Connext and raw UDP), the rest of the operations are independent of the data size and that time remains constant.
Connext Latency Test, publisher-side CSV table
Sample Size (Bytes)
Ave (μs)
Std (μs)
Min (μs)
Max (μs)
50% (μs)
90% (μs)
99% (μs)
99.99% (μs)
99.9999% (μs)
64
129
6.8
90
193
129
139
143
160
193
256
135
10.1
83
180
137
145
148
170
180
512
150
6.3
101
202
151
154
157
183
202
1024
160
7.1
125
212
163
166
171
181
212
4096
245
3.4
214
288
245
247
251
265
288
8192
351
3.3
316
397
351
353
356
371
397
16384
423
8.7
379
477
421
434
437
451
477
32768
522
7.3
489
598
522
530
539
572
598
63000
765
5.9
744
898
763
771
787
859
898
Raw UDP Latency Test, publisher-side CSV table
Sample Size (Bytes)
Ave (μs)
Std (μs)
Min (μs)
Max (μs)
50% (μs)
90% (μs)
99% (μs)
99.99% (μs)
99.9999% (μs)
64
93
20.2
42
157
97
112
116
120
157
256
110
8.6
67
176
113
119
122
127
176
512
111
3.8
75
182
111
114
124
134
182
1024
142
4.7
109
192
143
145
147
164
192
4096
224
4.6
196
266
225
227
229
262
266
8192
330
2.0
306
371
330
332
335
367
371
16384
397
4.2
351
449
397
400
411
423
449
32768
516
6.7
486
564
515
527
533
554
564
63000
766
5.1
735
854
767
769
783
792
854
Learn more#
In this module you learned how to use Perftest to measure the performance of your system. You can now explore all the options that Perftest offers to measure the performance of your system in the Perftest official documentation.
Next Steps
More about Connext performance and how to fine-tune it:
Reference documentation:
Perftest User’s Manual - learn to configure Perftest to effectively simulate your system
User’s Manual, Batching - learn how to configure batching and how it helps increase throughput
User’s Manual, Reliability Models - learn how to configure and fine tune the reliability protocol
