2. Wireshark Features for Packet Analysis
2.1. Menu Options
The main menu has several useful options. In particular:
File >> Merge: Merges two Wireshark captures so they can be analyzed together. When analyzing Connext systems, this can be useful if the discovery traffic is in one capture and the traffic showing the problem is in a different capture. You can use the “Time Shift” feature after merging (see below under Packet Options).
File >> Export Specified Packets: Similar to “Save As…” with extended capabilities, this allows you to save only Marked or Displayed packets, or a range of packets.
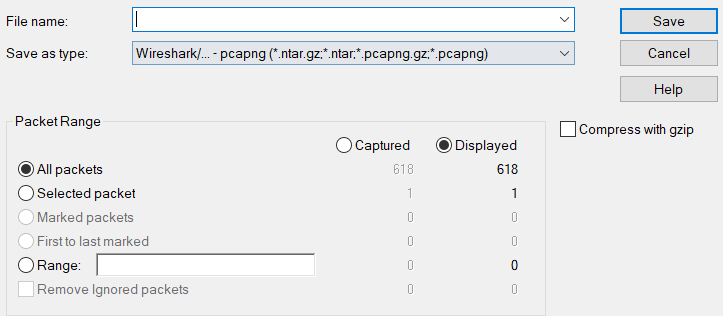
File >> Export Packet Dissections: Allows you to export the packets in different formats.
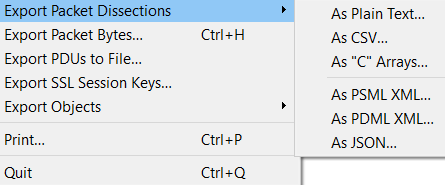
PDML XML contains all the information available in XML format. This is an interesting feature since mixing this export format with XSLT (to parse the content of the XML) enables you to create custom outputs quickly and easily.
Edit >> Delete All Packet Comments
Edit >> Preferences: Allows you to customize your Wireshark execution. The preferences are saved in your home directory so Wireshark remembers them between executions.
View >> Coloring rules: Useful for changing the Wireshark coloring rules. For example, you can make discovery data blue and user data (DDS traffic) red. For more information, see this article: https://community.rti.com/howto/how-configure-wireshark-show-rtps-packets-specific-colors.
Go >> Go to packet…: Goes to a specific packet number.
Go >> Auto Scroll in Live Capture: Sometimes it is inconvenient to have Wireshark automatically scroll down while capturing. This behavior can be quickly disabled/enabled here.
Analyze >> Enabled Protocols: You can disable protocols you know are not used in your system. This will improve the performance of Wireshark (a good practice but not typically needed).
Statistics >> Conversations and Statistics >> Endpoints: These two tables show information about the communication flow between endpoints and which endpoints are available. Note that the concept of an endpoint varies from one protocol to another. For example, in the IP protocol, an endpoint is defined by the IP address. In the UDP protocol, an endpoint is defined by the UDP address (IP address + port).
Statistics >> I/O graphs: This very useful feature shows a graph of the packets that pass the provided filter. Sometimes one picture is worth a thousand words.
Help: Contains documentation about Wireshark. Also shows information related to the installed version of Wireshark in “Help >> About Wireshark”.
2.2. User Data Dissection
Wireshark allows you to dissect the fields of user data samples. This section describes dissection using TypeObject v1. For TypeObject v2 and the TypeLookup Service, see TypeObject v2 and TypeLookup Service (Section 3).
There are two requirements for TypeObject v1 dissection:
The captured DataReader (DATA(r)) or DataWriter (DATA(w)) discovery packets must contain the TypeObject v1.
The data representation kind is set to CDR (CDR2 is not supported).
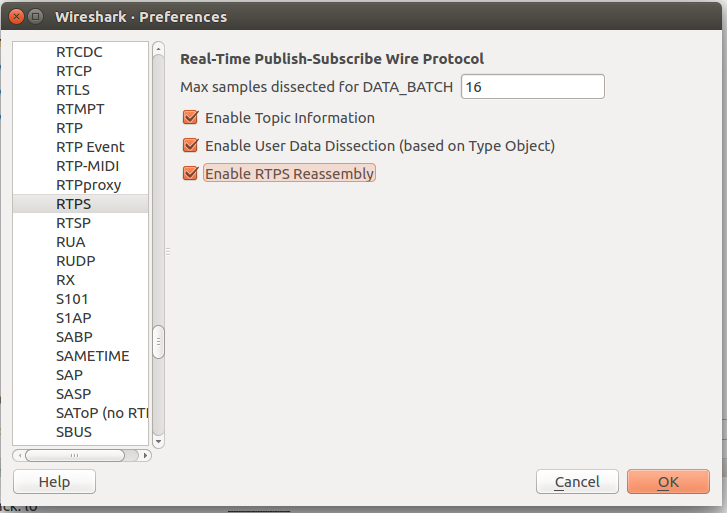
This feature can significantly increase dissection time, so it is not enabled by default. To enable it, select Edit > Preferences. In the Preferences window, select RTPS from the Protocols on the left and enable the checkbox for Enable User data Dissection (based on Type Object V1).
This feature allows you to dissect the Type Object and user data, even if it is compressed (only ZLIB compression is supported by the dissector).
2.2.1. Viewing Type Object Dissection
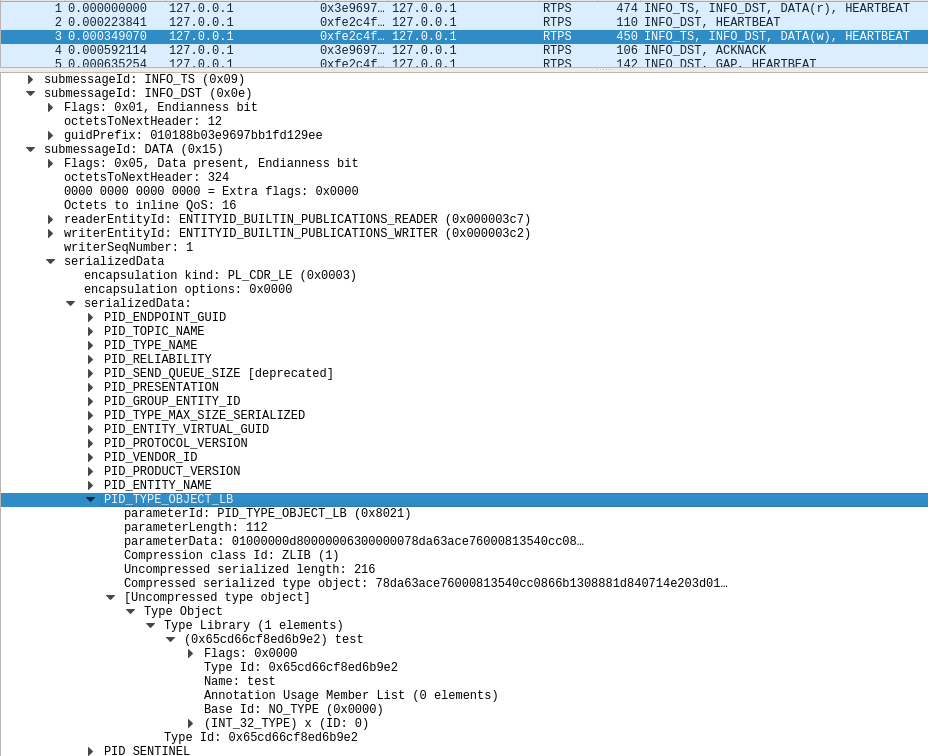
Once the feature is enabled, if a DATA(r) or DATA(w) is captured, Wireshark will dissect the Type Object of the selected packet. To see the Type Object dissection, select a packet. In the dissection tree, look under Real-Time Publish Subscribe Wire Protocol, SubMessageId DATA, serializedData, serializedData, PID_TYPE_OBJECT[_LB], Type Object.
The following image shows the dissection of a compressed Type Object of a type called Example test with a single int32 member called x.
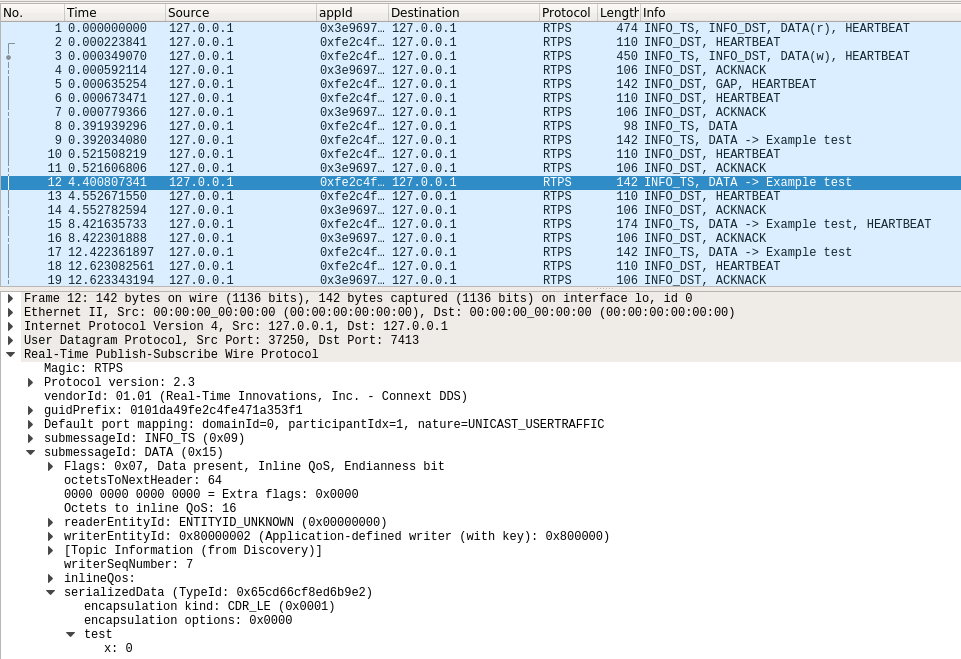
2.2.2. Viewing User Data Dissection
To see the user data dissection, select a User Data packet (DATA). In the dissection tree, look under Real-Time Publish Subscribe Wire Protocol, SubMessageId DATA, serializedData, [TYPE MEMBERS], where TYPE MEMBERS is the Data Type hierarchy.
The following image shows the dissection of a type with a top-level struct called test with a single int32 member called x.
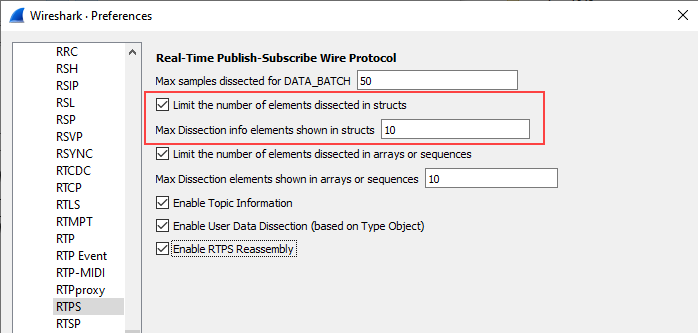
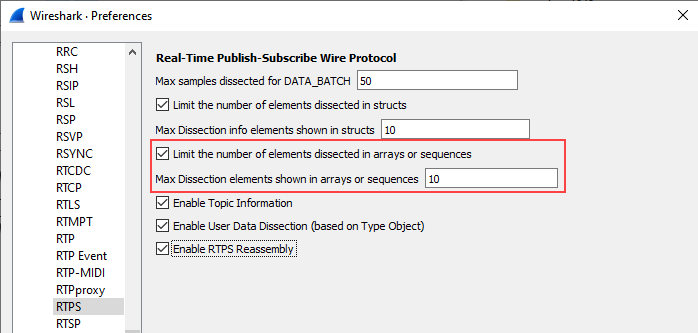
2.2.3. Limiting Elements in Sample Packets
The dissector can take a long time to process packets with large arrays or sequences. To speed up the process, you can limit the number of elements displayed when dissecting Type Object and user data samples.
RTPS Dissector includes the option to enable or disable element limitations and specify the maximum number of elements to display for arrays/sequences and structs. For example, the elements displayed for a type with the following structure can be limited to prevent Wireshark from slowing down.
TopStruct
   BigStruct
     long member1
     double member2
     string member3
     ...
     string member1000
   SmallStruct
     double a
     boolean b
     string c
If you limit elements for the above structure to ten, Wireshark displays the number of elements noted in Table 2.1.
Structure |
Elements Displayed |
|---|---|
TopStruct |
2 of 2 |
BigStruct |
The first 10 of 1000 |
SmallStruct |
3 of 3 |
If you limit the number of displayed elements shown in arrays or sequences, Wireshark likewise displays only up to the number of elements you specify. For example, if you have an array of 100 integers, and elements for arrays or sequences is limited to ten, only the first ten integers would display.
To limit the number of elements,
In Wireshark, go to Edit > Preferences.
On the left, select Protocols > RTPS.
To Limit the number of elements dissected in structs, select the checkbox and then enter the desired maximum.
To Limit the number of elements dissected in arrays or sequences, select the checkbox and then enter the desired maximum.
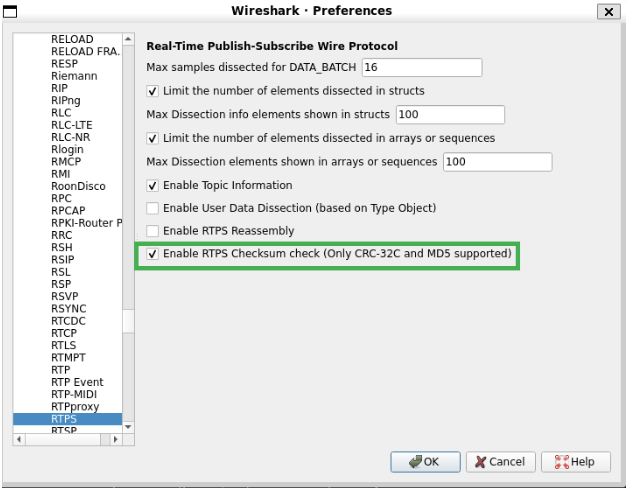
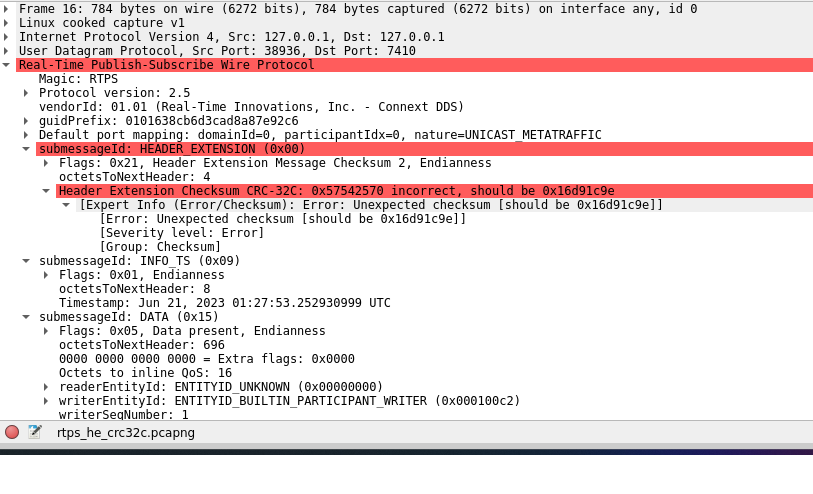
2.2.4. RTPS Checksum Check
Packets with the RTPS_HE (Header Extension) available include a checksum for detecting corrupted packets. Wireshark can check if the packet is corrupted by calculating the RTPS message checksum and comparing it with the expected checksum in the header extension. This feature supports CRC-32C and MD5 checksums only.
To enable this feature, go to Preferences > Protocols > RTPS and select the option Enable RTPS Checksum check. This option is disabled by default.
Once enabled, Wireshark reviews the checksums where available. If the expected and calculated checksums are different, an error displays in the Expert Information dialog, as shown below.
2.3. Packet Options
Right-clicking on a packet in the Columns view will give you several options. The ones in red (below) are commonly used for analysis of RTPS:
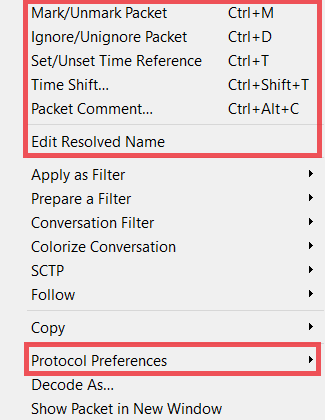
Mark/Unmark: Marks the packet in black or unmarks it. This is useful for filtering (frame.marked == 1) or exporting only marked packets.
Ignore/Unignore: Ignores a packet, so it is displayed as “Ignored”. This is useful when packets are not related to your analysis and you don’t want them to be present in your analysis (instead of filtering them out).
Set/Unset Time Reference: Makes the time of the selected packet be the time reference for all the packets captured after it. Several time references can be used.
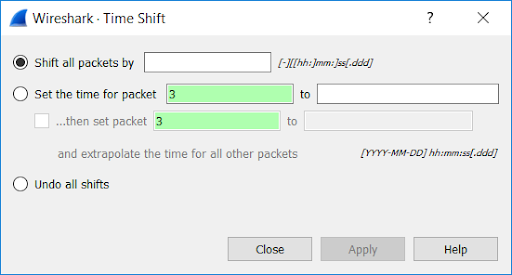
Time Shift: Allows you to change the time of the packets.
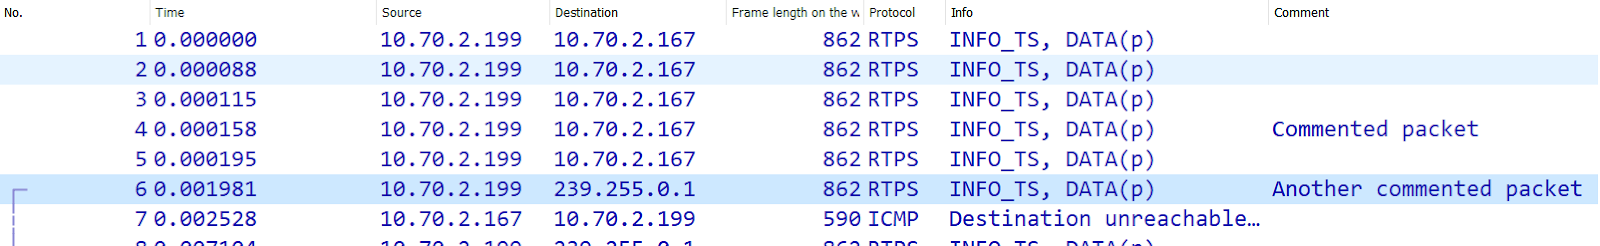
Packet Comment: Useful for providing comments to another colleague. For example, you can add the comments to the packets and then filter using “pkt_comment” to only display the packets with comments. Another option is to add the comment as a column:
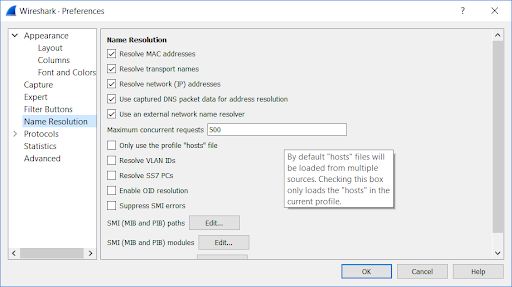
Edit Resolved Name: Useful for replacing IP addresses with actual names. If DNS information is available in the capture, Wireshark will use it. You can also overwrite those names or enter new names. You must first enable this feature in Preferences, Name Resolution.
Protocol Preferences: This is another way to set protocol preferences instead of choosing the RTPS protocol in the Preferences menu. Protocol Preferences show the preferences available to configure (for example, the Topic Information feature).
2.4. Layer Options
Wireshark shows all the protocols contained in a packet. This is called the Layer view. The Layer view can be used to display the content of each layer.
The Internet Protocol Version 4 (IP) contains useful information:
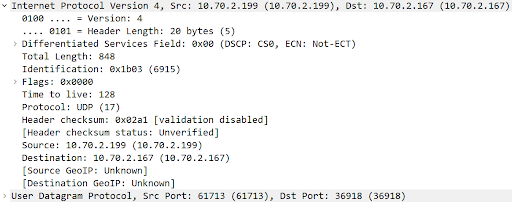
Identification: All the IP packets containing the same Identification represent the same payload. For example, if a UDP datagram is split into ten IP packets, those ten packets contain the same Identification.
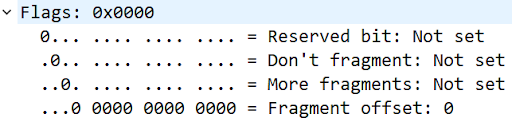
Flags: “More fragments” will be 1 if more fragments are expected for this Identification. In the example above, the first nine IP packets will have “More fragments” set to 1, and the last IP packet will have “More fragments” set to 0.
Source and Destination IP addresses.
From the UDP Layer, you can get the ports used for communication. The fields of the RTPS layer will be explained in the next section. For every field shown in the Layer view, you can right-click to get these menu options:
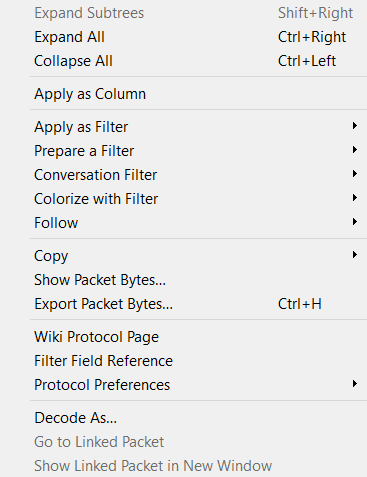
The more commonly used options in RTPS analysis are:
Apply as Column: Makes this field a column in the Packet columns view. This is useful when analyzing specific problems in RTPS. For example, showing the Sequence Number of the RTPS submessages is very helpful when analyzing reliability problems.
Apply as Filter: Uses the field to create a filter and applies it. Useful when the filter expressions are not known (for example, if you want to filter by this Writer but don’t know the expression to do it).
Prepare a Filter: Same as above but without applying the filter. It just shows the filter; you have to press “enter” to apply it.
Colorize with Filter: Colorizes the packets that pass the filter (i.e., the packets that contain the selected field). This is useful for differentiating the packets instead of filtering them out.
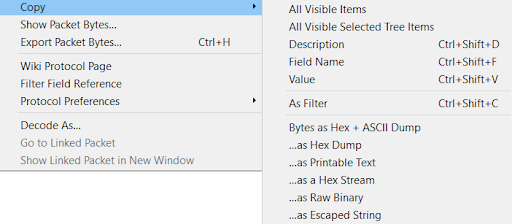
Copy: Copies the field in the specified format.
The ICMP layer is also important in the analysis of problems. ICMP messages inform you when the destination is unreachable, when TTL is exceeded, fragment reassembly time is exceeded, and so on. More information is here: https://en.wikipedia.org/wiki/Internet_Control_Message_Protocol.
2.5. Topic Information Feature
There isn’t any information in the DATA submessage that directly indicates the associated Topic or Type. The information needed to find the Topic or Type for a given sample is given in the discovery phase.
The DATA submessage contains the DataWriter GUID (GUID Prefix + WriterEntityId).
The discovery information contains the mapping between the DataWriter GUID and the Topic.
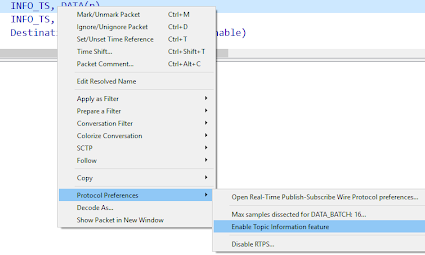
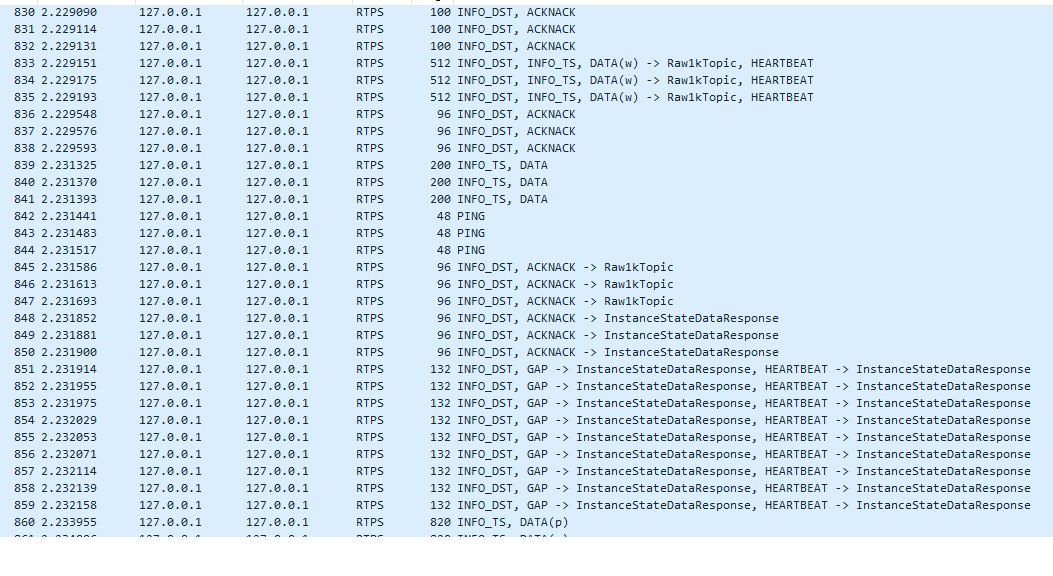
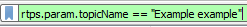
Wireshark can correlate the discovery traffic and the DATA submessages for you. This feature is called Topic Information. To enable it, right-click on any RTPS packet and select Protocol Preferences >> Enable Topic Information feature:
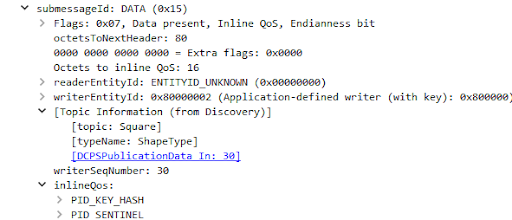
If the discovery data associated with a DataWriter is available in the Wireshark capture, Wireshark will show the Topic Information subtree inside the submessage:
And the columns view will show the Topic Name:

In addition, the topic and type filters will show all the packets related to the topic and filter (including HEARTBEAT, ACKNACK, DATA, etc):
When Wireshark shows the Topic Information for a given DATA submessage, it tries to dissect the Serialized Data (the CDR byte array) by calling a dissector registered for that Type Name. If the dissector happens to be registered, the data will be passed to that dissector. This means you can create your own User Data dissectors and have Wireshark call them. If the dissector is not registered (default behavior), it will show the CDR byte array. It is your responsibility to write a dissector for your specific type (IDL).