3. Deployment Scenarios
This section describes Observability Framework deployment options.
3.1. Current Release
This release supports running Collector Service in storage mode only. In this mode, the telemetry data is stored in Prometheus (metrics) and Grafana Loki (logs). Because forwarding mode is not supported, you can only use a single layer of Collector Services per Connext system. This configuration is illustrated in Figure 3.1.
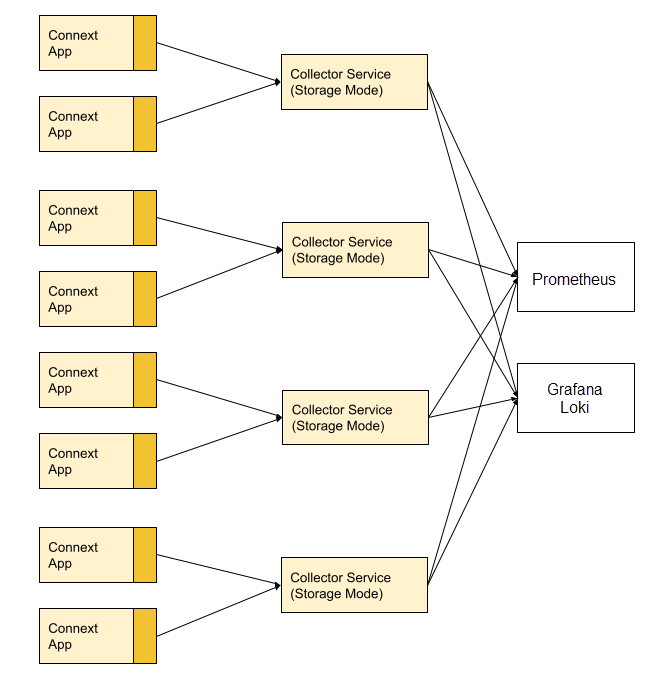
Figure 3.1 Single Layer Collector Deployment
The deployment represented in Figure 3.1 requires running multiple standalone instances of Collector Service where each Connext application configures Observability Library to connect to one of the Collector Service instances. This release distributes Collector Service as a Docker image; for details, refer to the Docker (Separate Deployment) section.
When using a single layer collector deployment, you are responsible for running the Prometheus and Grafana Loki instances and configuring the Docker container for Collector Service to connect to these storage backends.
Alternately, you can use a single layer deployment to run only one Collector Service instance for the Connext system, as illustrated in Figure 3.2. To deploy Observability Framework using a single collector (including the third-party components Prometheus and Grafana), you can use Docker Compose as described in the Docker Compose (Prepackaged) section.
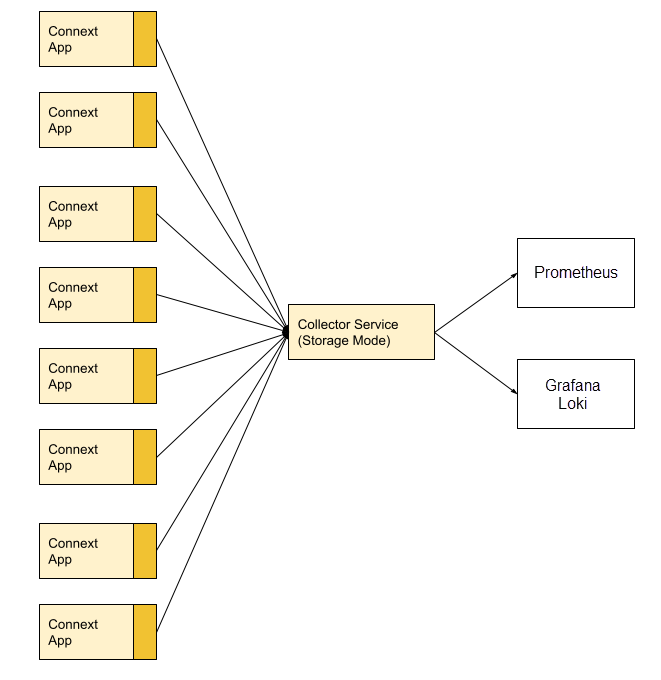
Figure 3.2 Single Collector Deployment
3.2. Future Releases
As you roll out telemetry data collection and distribution across all your Connext applications, Observability Framework must be deployed in a way that supports the additional load. A single layer Collector Service deployment, as shown in Figure 3.1, may not scale sufficiently.
A better deployment option would be the layered deployment depicted in Figure 3.3. In this option, you have multiple layers of Collector Service gathering, filtering, and forwarding the telemetry data produced by the Connext applications. Each intermediate layer reduces the number of egress points required to send data and provides an opportunity to filter telemetry data. The last layer works as a storage layer and is responsible for storing the telemetry data into a third-party observability backend.
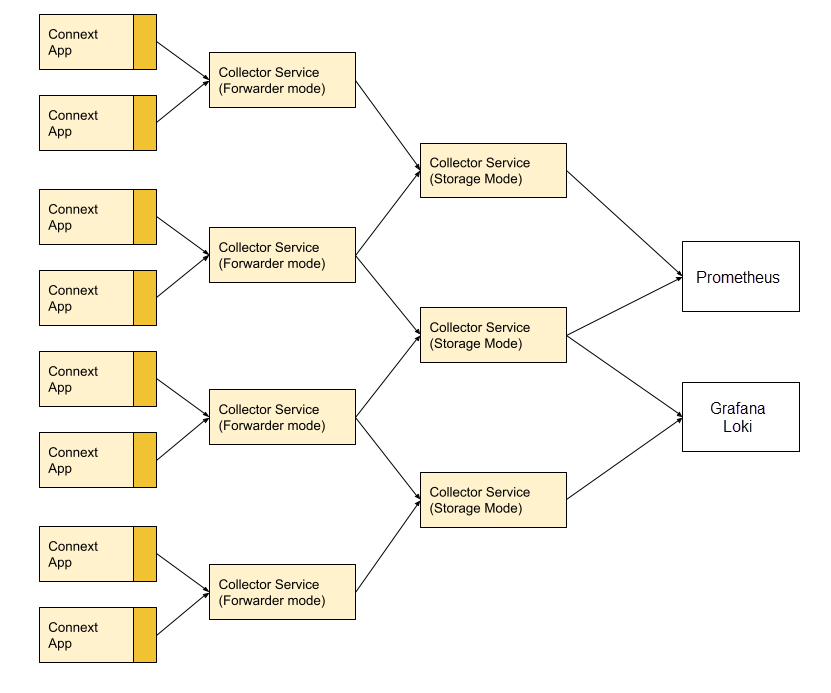
Figure 3.3 Layered Collector Deployment
In addition, future releases will support third-party backends other than Prometheus and Grafana Loki by using OpenTelemetry and the OTel Collector, as showin in Figure 3.4.
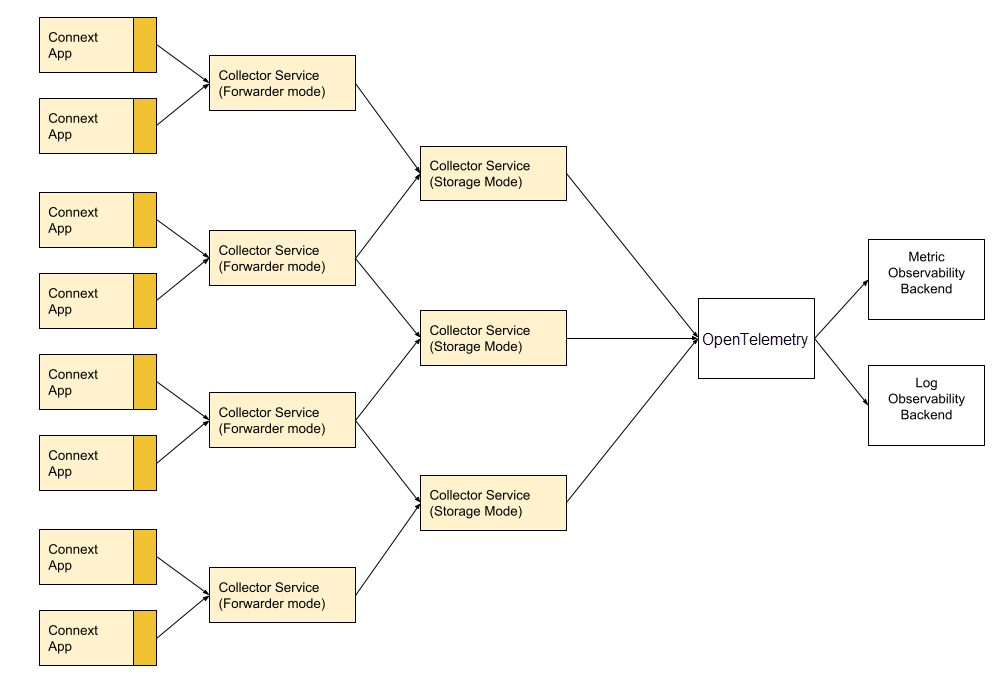
Figure 3.4 Layered Collector Deployment Using OTel Collector