4. Installing and Running Observability Framework
RTI Connext Observability Framework is not installed as part of RTI Connext Professional Edition. Observability Framework must be downloaded and installed separately. For information on how to obtain the Observability Framework package, check the RTI Customer portal, contact support@rti.com, or contact your account team.
There are two Observability Framework packages, as outlined in Table 4.1.
Package Name |
Package Contents |
Use Case |
Supported Platform |
|---|---|---|---|
rti_observability-7.1.0-target-<your platform>.rtipkg |
The target package installs Observability Library in your target platform(s). |
Install this package if you need to collect and distribute telemetry data emitted by DDS applications on the target platform. |
Observability Library is supported in all Connext platforms. |
rti_observability-7.1.0-host-x64Linux.rtipkg |
The host package contains the files required to run the Observability Framework collection, storage, and visualization components using Docker and Docker Compose. This package also includes Observability Framework documentation. |
Install this package if you need to run the collection, storage, and visualization components. |
These components are only supported in Linux. |
In the rest of this chapter, <installdir> refers to the installation
directory for Connext.
Important
Observability Framework is an experimental product that includes example configuration files for use with several third-party components (Prometheus, Grafana Loki, and Grafana). This release is an evaluation distribution; use it to explore the new observability features that support Connext applications.
Do not deploy any Observability Framework components in production.
4.1. Installing the Target Package
There are two ways to install Observability Library: using RTI Launcher
or the rtipkginstall command-line utility.
Note
For detailed information about Observability Library, see the MONITORING QosPolicy (DDS Extension).
4.1.1. Install from RTI Launcher
To install the Observability Framework target package from RTI Launcher:
Start Launcher from the Start menu, or from the command line using
<installdir>/bin/rtilauncher.From the Configuration tab, click Install RTI Packages.
Use the plus (+) sign to add the
rti_observability-7.1.0-target-<your platform>.rtipkgfile.Click Install.
4.1.2. Install from the Command Line
To install the Observability Framework target package from the command line, run:
$ <installdir>/bin/rtipkginstall /<path-to-observability-framework-file>/rti_observability-7.1.0-target-<your platform>.rtipkg
4.2. Installing the Host Package
There are two ways to install the documentation and files supporting the
Docker containers used by Observability Framework: using RTI Launcher
or the rtipkginstall command-line utility.
4.2.1. Prerequisites
The following applications must be installed before installing the experimental Observability Framework product.
Connext 7.1.0. For installation instructions, see the RTI Connext Installation Guide.
Docker Engine v20.10.x or higher. For installation instructions, see Docker’s Engine installation overview.
Docker Compose Plugin v2.x or higher. For installation instructions, see Docker’s installation instructions.
4.2.2. Install from RTI Launcher
To install the Observability Framework host package from RTI Launcher:
Start Launcher from the Start menu, or from the command line using:
<installdir>/bin/rtilauncher.From the Configuration tab, click Install RTI Packages.
Use the plus (+) sign to add the
rti_observability-7.1.0-host-x64Linux.rtipkgfile.Click Install.
4.2.3. Install from the Command Line
To install the Observability Framework host package from the command line, run:
$ <installdir>/bin/rtipkginstall /<path-to-observability-framework-file>/rti_observability-7.1.0-host-x64Linux.rtipkg
4.3. Configuring and Running Observability Framework Components
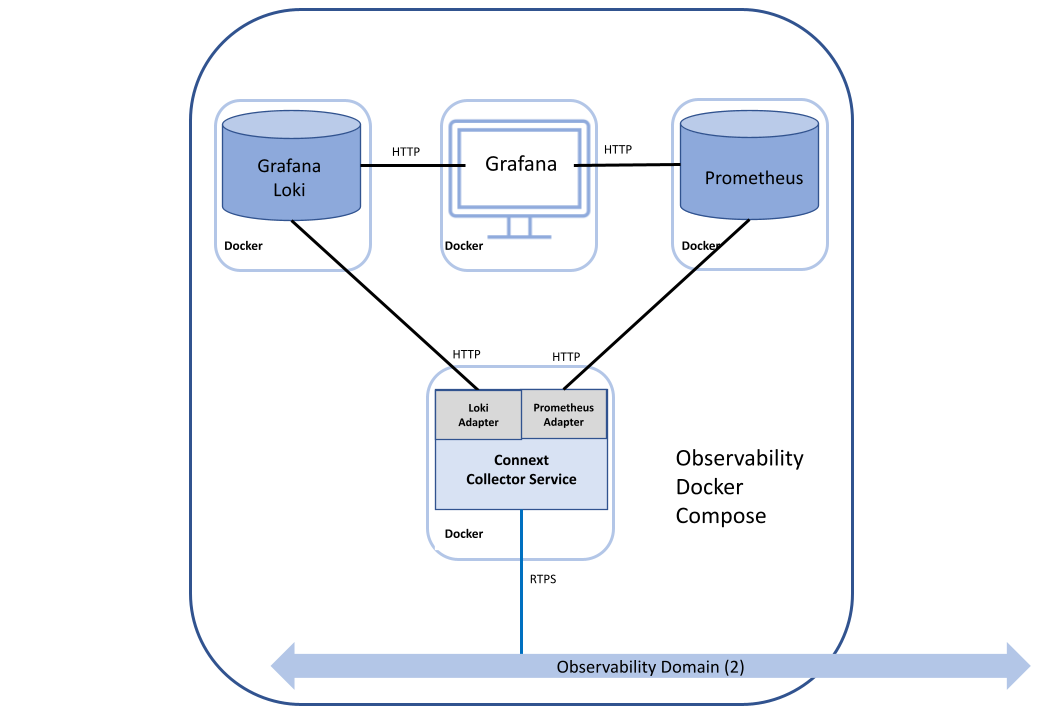
The telemetry data emitted by Observability Library is collected, stored, and visualized using the following components:
RTI Observability Collector Service
Prometheus
Grafana Loki
Grafana
The files required to run these components are installed by the Observability Framework host package. In this release, the collection, storage, and visualization components only run in a single Linux host using Docker and Docker Compose. Future releases will offer the ability to install the components independently without using Docker.
Your use of the Docker images for Prometheus, Grafana Loki, and Grafana must comply with the applicable license terms for each of those components.
Before creating and running the Docker containers for Observability
Framework, the associated configuration files that comprise the Docker
workspace must be created and copied to the
rti_workspace/7.1.0/user_config/observability directory. This is done using
the <installdir>/bin/rtiobservability script.
The <installdir>/bin/rtiobservability script has two modes of operation, SETUP
and RUN.
SETUP mode creates and copies the configuration files required for the Docker containers used in Observability Framework to the
rti_workspace/7.1.0/user_config/observabilitydirectory.RUN mode controls creating and running the Docker containers used in Observability Framework.
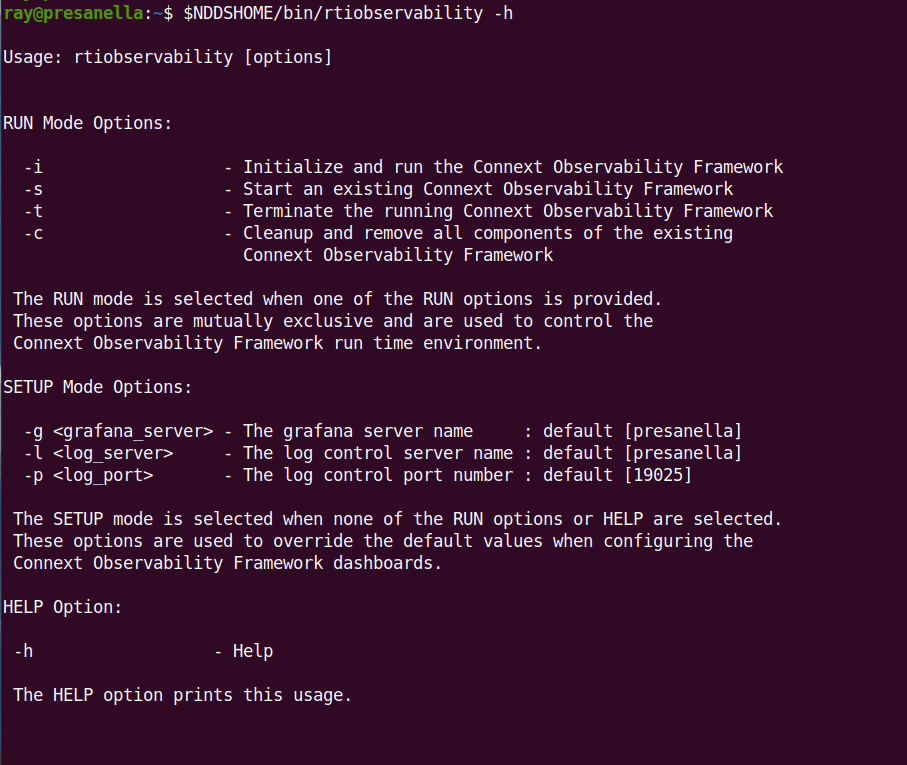
To view the options for the <installdir>/bin/rtiobservability
script, run <installdir>/bin/rtiobservability -h:
The Docker containers for Observability Framework created by the
<installdir>/bin/rtiobservability script (see Configure the Docker Workspace for Observability Framework)
include software from third parties, including:
Warning
Such third-party software is subject to third-party license terms and conditions. IT IS YOUR RESPONSIBILITY TO ENSURE THAT YOUR USE OF THIRD-PARTY SOFTWARE COMPLIES WITH THE CORRESPONDING THIRD-PARTY LICENSE TERMS AND CONDITIONS.
4.3.1. Configure the Docker Workspace for Observability Framework
The Docker workspace is composed of the set of files that are used to create and
configure the Docker containers required to run Observability Framework. The
Docker workspace files used by Observability Framework must be created and
copied into the rti_workspace/7.1.0/user_config/observability directory
before running the Docker containers for Observability Framework.
Note
After configuring the Docker workspace, you will have to delete the
rti_workspace/7.1.0/user_config/observability
directory to change the Docker workspace configuration.
To configure the workspace, run the <installdir>/bin/rtiobservability script
and, optionally, include one or more of the following command-line switches.
Parameter |
Data Type |
Description |
Default |
|---|---|---|---|
-g |
<str> |
Name of the machine hosting Grafana |
|
-l |
<str> |
Name of the machine hosting Grafana Loki |
|
-p |
<int> |
Port used by Observability Collector Service for the HTTP control. |
19098 |
Typically, if you run the Docker containers for Observability Framework
within a LAN, you will not need to use any of the above options because the
default configuration will work. However, if you plan to the deploy the
Docker containers for Observability Framework in a WAN environment (for
example, an AWS instance), use the -g option to specify the public IP of
the host where the Docker containers are run to configure Grafana.
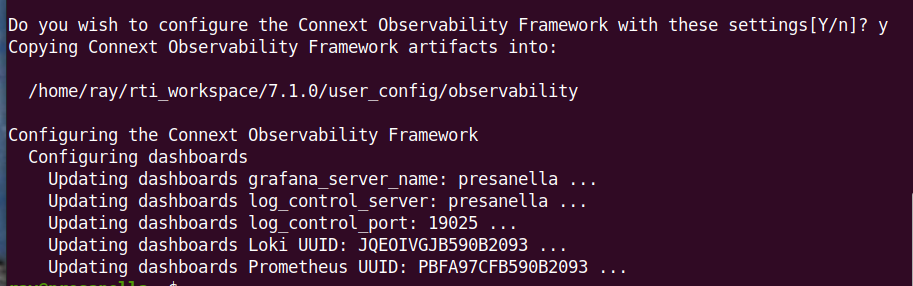
Run the <installdir>/bin/rtiobservability script to configure the Docker
workspace.
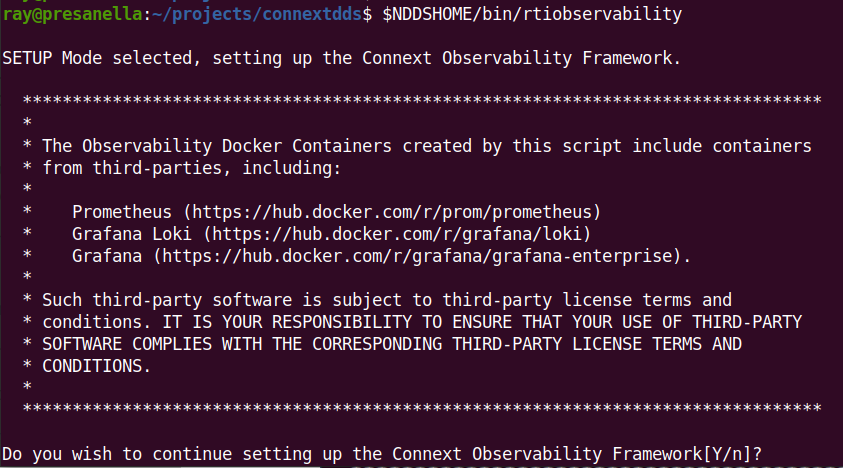
Select Y (or simply enter) to acknowledge the license statement.
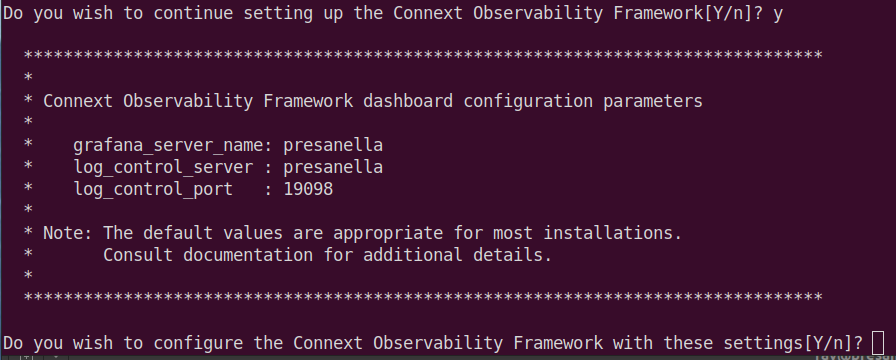
Select Y (or simply enter) to create and configure the Docker workspace
for Observability Framework.
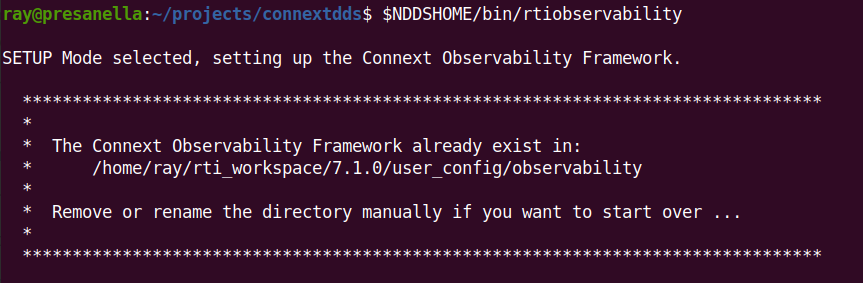
If you attempt to create and configure the Docker workspace for Observability Framework and it already exists, you will see the following warning.
4.3.1.1. Configuring Ports Used by Observability Components
The Docker Components in Observability Framework use dedicated ports for the collection and distribution of metrics and log data. The default configuration of these ports is shown in Table 4.3.
Component Name |
Port |
|---|---|
Prometheus Server |
|
Grafana |
|
Grafana Loki |
|
Observability Collector Service Prometheus Client |
|
Observability Collector Service Control Server |
|
If these port definitions conflict with existing port usage in your system, you may have to change them to de-conflict so that the Docker components for Observability Framework can run.
4.3.1.1.1. Configuring the Prometheus Server Port
To change the default port of 9090 for the Prometheus Server in
Observability Framework, you need to modify the files in
Table 4.4.
These files are located in the rti_workspace/7.1.0/user_config/observability
directory and the paths in the table are relative to this directory.
File Name |
|---|
grafana/datasource/datasource.yml |
prometheus/prometheus.yml |
docker-compose.yml |
Important
If the Prometheus Server port is changed, all files listed in Table 4.4 must be updated using your preferred port.
In the file grafana/datasource/datasource.yml, modify the port for the
Prometheus datasources url as shown in the highlighted line in the snippet below.
Change 9090 to your preferred port.
datasources:
  - name: Prometheus
    type: prometheus
    access: proxy
    orgId: 1
    uid: PBFA97CFB590B2093
    url: http://localhost:9090
    isDefault: true
    jsonData:
    timeInterval: 10s
In the file prometheus/prometheus.yml, modify the targets port for the
prometheus job_name as shown in the highlighted line in the snippet below.
Change 9090 to your preferred port.
#
# Scrape configuration
#
scrape_configs:
#
# The job name is added as a label `job=<job_name>` to any timeseries scraped from this config.
#
# Configuration for Prometheus exporter in a system
#
- job_name: 'prometheus'

   # metrics_path defaults to '/metrics'
   # scheme defaults to 'http'.

   static_configs:
   - targets:
      - localhost:9090 # Prometheus metrics
In file docker-compose.yml, add the highlighted line shown in the snippet
below. Change 9090 to your preferred port.
prometheus:
   image: prom/prometheus:v2.37.5
   container_name: prometheus_observability
   volumes:
      - ./prometheus:/etc/prometheus
      - prometheus_data:/prometheus
   command:
      - '--config.file=/etc/prometheus/prometheus.yml'
      - '--storage.tsdb.path=/prometheus'
      - '--web.console.libraries=/etc/prometheus/console_libraries'
      - '--web.console.templates=/etc/prometheus/consoles'
      - '--storage.tsdb.retention.time=200h'
      - '--query.lookback-delta=30s'
      - '--web.enable-lifecycle'
      - '--web.enable-admin-api'
      - '--web.listen-address=0.0.0.0:9090'
   restart: unless-stopped
4.3.1.1.2. Configuring the Grafana Port
To change the default port of 3000 for Grafana in Observability Framework,
you need to modify the files in Table 4.5.
These files are located in the rti_workspace/7.1.0/user_config/observability
directory and the paths in the table are relative to this directory.
File Name |
|---|
grafana/grafana.ini |
prometheus/prometheus.yml |
grafana/dashboards/General/*.json |
Important
If the Grafana port is changed, all files listed in Table 4.5 must be updated using your preferred port.
In the file grafana/grafana.ini, modify the port for http_addr as shown
in the highlighted line in the snippet below. Uncomment the line by removing the
preceding ; and change 3000 to your preferred port.
#################################### Server ####################################
[server]
# Protocol (http, https, h2, socket)
;protocol = http

# The ip address to bind to, empty will bind to all interfaces
;http_addr =

# The http port  to use
;http_port = 3000

# The public facing domain name used to access grafana from a browser
;domain = localhost
In the file prometheus/prometheus.yml, modify the targets port for the
grafana job_name as shown in the highlighted line in the snippet below.
Change 3000 to your preferred port.
#
# The job name is added as a label `job=<job_name>` to any timeseries scraped from this config.
#
# Configuration for Grafana exporter in a system
#
- job_name: 'grafana'

   # metrics_path defaults to '/metrics'
   # scheme defaults to 'http'.

   static_configs:
   - targets:
     - localhost:3000 # Grafana metrics
In the grafana/dashboards/General/*.json files, modify all occurrences of
http://${grafana_server_name}:3000, highlighted in the snippet below.
Change 3000 to your preferred port.
"links": [
  {
    "title": "DataReader List",
    "url": "http://${grafana_server_name}:3000/d/6qjWHdPnk/datareader-list?orgId=1&${__url_time_range}&refresh=10s"
  }
],
4.3.1.1.3. Configuring Grafana Loki Port
To change the default port of 3100 for Grafana Loki in Observability
Framework, you need to modify the files listed in
Table 4.6.
These files are located in the rti_workspace/7.1.0/user_config/observability
directory and the paths in the table are relative to this directory.
File Name |
|---|
grafana/datasource/datasource.yml |
loki/loki-config.yml |
docker-compose.yml |
Important
If the Grafana Loki port is changed, all files listed in Table 4.6 must be updated using your preferred port.
In the file grafana/datasource/datasource.yml, modify the port for the
Loki datasources url as shown in the highlighted line in the snippet below.
Change 3100 to your preferred port.
datasources:
- name: Prometheus
   type: prometheus
   access: proxy
   orgId: 1
   uid: PBFA97CFB590B2093
   url: http://localhost:9080
   isDefault: true
   jsonData:
      timeInterval: 10s

- name: Loki
   type: loki
   access: proxy
   orgId: 1
   uid: JQEOIVGJB590B2093
   url: http://localhost:3100
   isDefault: false
In the file loki/loki-config.yml, modify the http_listen_port as
shown in the highlighted line in the snippet below. Change 3100 to your
preferred port.
auth_enabled: false

server:
http_listen_port: 3100
In file docker-compose.yml, modify the port for the LOKI_SERVER_ADDRESS
as shown in the highlighted line in the snippet below. Change 3100 to your
preferred port.
collector_service:
   image: rticom/collector_service:7.1.0
   container_name: collector_service_observability
   stop_signal: SIGINT
   volumes:
      - $RTI_LICENSE_FILE:/rti/rti_license.dat
   environment:
      - OBSERVABILITY_DOMAIN=${OBSERVABILITY_DOMAIN-2}
      - LOKI_SERVER_ADDRESS=${LOKI_SERVER_ADDRESS-http://localhost:3100}
      - LOKI_EXPORTER_PUSH_PERIOD=${LOKI_EXPORTER_PUSH_PERIOD-1}
      - PROMETHEUS_EXPORTER_ADDRESS=${PROMETHEUS_EXPORTER_ADDRESS-http://localhost:19090}
      - COLLECTOR_EXPORTER_ADDRESS=${COLLECTOR_EXPORTER_ADDRESS-http://localhost:19098}
      - COLLECTOR_PUBLIC_IP=${COLLECTOR_PUBLIC_IP-NONE}
      - COLLECTOR_PUBLIC_PORT=${COLLECTOR_PUBLIC_PORT-30000}
      - ARGS="-verbosity WARNING"
   restart: unless-stopped
4.3.1.1.4. Configuring Observability Collector Service Prometheus Client Port
The Observability Collector Service Prometheus Client Port is for the HTTP
Server created by the Prometheus client and scraped by the Prometheus server.
To change the default port of 19090 for Observability Collector Service
Prometheus Client port in Observability Framework, you need to modify
the files in Table 4.7.
These files are located in the rti_workspace/7.1.0/user_config/observability
directory and the paths in the table are relative to this directory.
File Name |
|---|
prometheus/prometheus.yml |
docker-compose.yml |
Important
If the Observability Collector Service Proemtheus Client port is changed, all files in this section must be updated using your preferred port.
In the file prometheus/prometheus.yml, modify the targets port for the
dds job_name as shown in the highlighted line in the snippet below. Change
19090 to your preferred port.
 #
 # The job name is added as a label `job=<job_name>` to any timeseries scraped from this config.
 #
 # Configuration for DDS exporter in a system
 #
 - job_name: 'dds'

   # metrics_path defaults to '/metrics'
   # scheme defaults to 'http'.

   static_configs:
   - targets:
     - localhost:19090 # dds metrics
In file docker-compose.yml, modify the port for the PROMETHEUS_EXPORTER_ADDRESS
in the highlighted line shown in the snippet below. Change 19090 to your
preferred port.
collector_service:
   image: rticom/collector_service:7.1.0
   container_name: collector_service_observability
   stop_signal: SIGINT
   volumes:
      - $RTI_LICENSE_FILE:/rti/rti_license.dat
   environment:
      - OBSERVABILITY_DOMAIN=${OBSERVABILITY_DOMAIN-2}
      - LOKI_SERVER_ADDRESS=${LOKI_SERVER_ADDRESS-http://localhost:3100}
      - LOKI_EXPORTER_PUSH_PERIOD=${LOKI_EXPORTER_PUSH_PERIOD-1}
      - PROMETHEUS_EXPORTER_ADDRESS=${PROMETHEUS_EXPORTER_ADDRESS-http://localhost:19090}
      - COLLECTOR_EXPORTER_ADDRESS=${COLLECTOR_EXPORTER_ADDRESS-http://localhost:19098}
      - COLLECTOR_PUBLIC_IP=${COLLECTOR_PUBLIC_IP-NONE}
      - COLLECTOR_PUBLIC_PORT=${COLLECTOR_PUBLIC_PORT-30000}
      - ARGS="-verbosity WARNING"
   restart: unless-stopped
4.3.1.1.5. Configuring Observability Collector Service Control Server Port
The Observability Collector Service Control Server Port is where the HTTP server
for Log Control is located. To change the default port of 19098 for
Observability Collector Service Control Server Port in the Observability
Framework, you need to modify the files in
Table 4.8.
These files are located in the rti_workspace/7.1.0/user_config/observability
directory and the paths in the table are relative to this directory.
File Name |
|---|
docker-compose.yml |
grafana/dashboards/General/rti-log-control.json |
Important
If the Observability Collector Service Control Server port is changed, all files listed in Table 4.8 must be updated using your preferred port.
In file docker-compose.yml, modify the port for the COLLECTOR_EXPORTER_ADDRESS
in the highlighted line shown in the snippet below. Change 19098 to your
preferred port.
collector_service:
   image: rticom/collector_service:7.1.0
   container_name: collector_service_observability
   stop_signal: SIGINT
   volumes:
      - $RTI_LICENSE_FILE:/rti/rti_license.dat
   environment:
      - OBSERVABILITY_DOMAIN=${OBSERVABILITY_DOMAIN-2}
      - LOKI_SERVER_ADDRESS=${LOKI_SERVER_ADDRESS-http://localhost:3100}
      - LOKI_EXPORTER_PUSH_PERIOD=${LOKI_EXPORTER_PUSH_PERIOD-1}
      - PROMETHEUS_EXPORTER_ADDRESS=${PROMETHEUS_EXPORTER_ADDRESS-http://localhost:19090}
      - COLLECTOR_EXPORTER_ADDRESS=${COLLECTOR_EXPORTER_ADDRESS-http://localhost:19098}
      - COLLECTOR_PUBLIC_IP=${COLLECTOR_PUBLIC_IP-NONE}
      - COLLECTOR_PUBLIC_PORT=${COLLECTOR_PUBLIC_PORT-30000}
      - ARGS="-verbosity WARNING"
   restart: unless-stopped
In the grafana/dashboards/General/rti-log-control.json file, modify all
occurrences of 19098 as shown in the highlighted lines in the snippet below.
Change 19098 to your preferred port.
{
  "current": {
    "selected": false,
    "text": "19098",
    "value": "19098"
  },
  "description": "Log Control Port",
  "hide": 2,
  "label": "Log Control Port",
  "name": "log_control_port",
  "query": "19098",
  "skipUrlSync": false,
  "type": "constant"
},
4.3.2. Initialize and Run Docker Containers
Important
An RTI license is required to run Observability Collector Service in a Docker container:
If you plan to send telemetry data to an Observability Collector Service instance running on the WAN (for example, AWS) using RTI Real-Time WAN Transport, you need a valid Connext Anywhere license.
Otherwise, you need a valid Connext Professional license.
For instructions on how to install a license file, see Installing the License File in the RTI Connext Installation Guide.
After the Docker workspace is configured, run
<installdir>/bin/rtiobservability -i to create and start the Docker
containers for Observability Framework. The -i option calls
docker compose up -d to create the required
storage volumes and containers, then starts the containers.
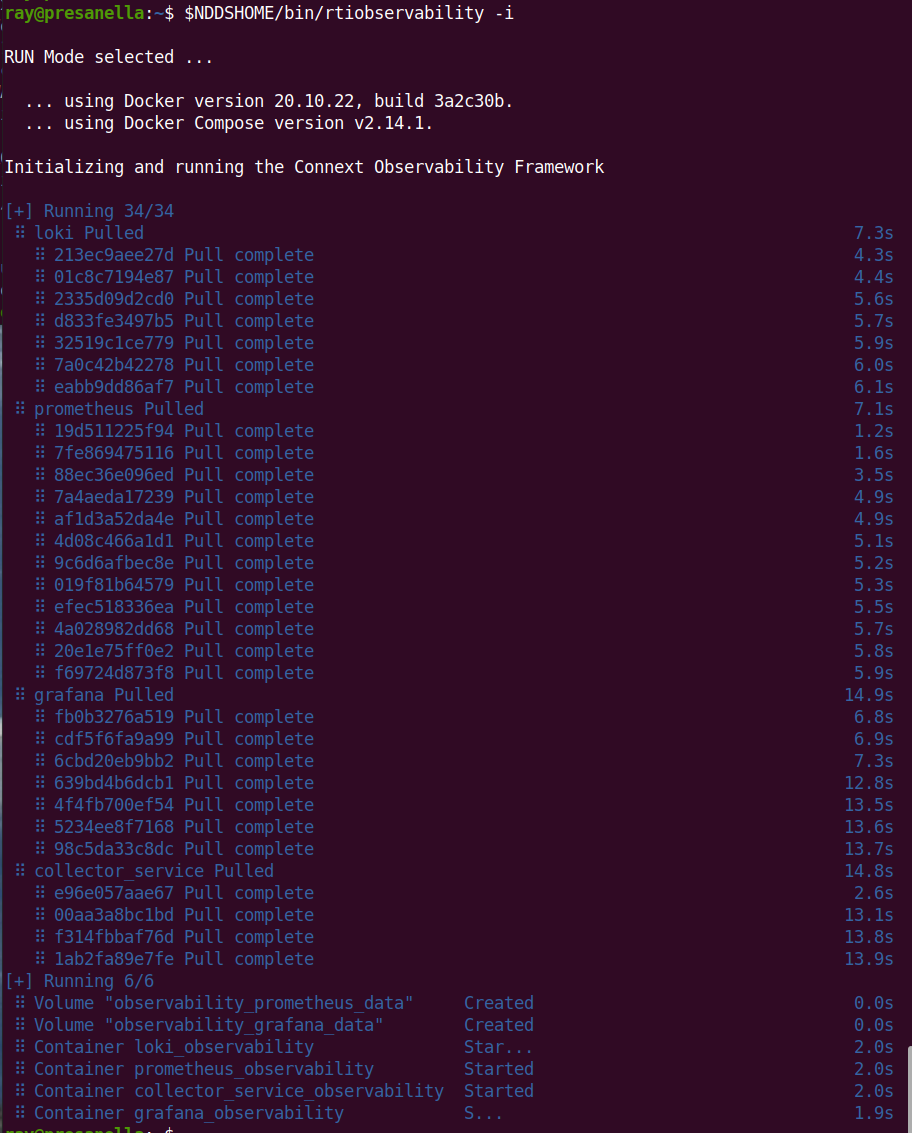
Three things happen upon running <installdir>/bin/rtiobservability
with the -i option.
The Docker images for Grafana Loki, Prometheus, Grafana, and Observability Collector Service are pulled from Docker Hub to your local Docker image store. Note that this will only happen if there are no local images found.
The Docker data volumes are created for the Prometheus and Grafana data storage.
Docker containers for Observability Framework are started for the four components (Loki, Prometheus, Grafana, and Observability Collector Service).
At this point, the Docker containers used by Observability Framework are started and all components should be running.
4.3.3. Verify Docker Containers are Running
To verify that all Docker containers used by Observability Framework are
running, run the command docker ps -a. Examine the STATUS column and
verify that all containers report a status of Up, as shown below.
CONTAINER ID  IMAGE                                    COMMAND                 CREATED        STATUS        NAMES
6651d7ed9810  prom/prometheus:v2.37.5                  "/bin/prometheus --c…"  5 minutes ago  Up 5 minutes  prometheus_observability
25050d16b1b5  grafana/grafana-enterprise:9.2.1-ubuntu  "/run.sh"               5 minutes ago  Up 5 minutes  grafana_observability
08611ea9b255  rticom/collector_service:7.1.0           "/rti_connext_dds-7.…"  5 minutes ago  Up 5 minutes  collector_service_observability
55568de5120f  grafana/loki:2.7.0                       "/usr/bin/loki --con…"  5 minutes ago  Up 5 minutes  loki_observability
When a container does not start,
the STATUS column displays Restarting to indicate the
prometheus-observability container failed to start and repeatedly tried
to restart.
CONTAINER ID  IMAGE                                    COMMAND                 CREATED        STATUS                         NAMES
08f75e0fadb2  prom/prometheus:v2.37.5                  "/bin/prometheus --c…"  5 minutes ago  Restarting (1) 27 seconds ago  prometheus_observability
9a3964b561ec  grafana/loki:2.7.0                       "/usr/bin/loki --con…"  5 minutes ago  Up 5 minutes                   loki_observability
b6a6ffa201f3  rticom/collector_service:7.1.0           "/rti_connext_dds-7.…"  5 minutes ago  Up 5 minutes                   collector_service_observability
26658f76cfdc  grafana/grafana-enterprise:9.2.1-ubuntu  "/run.sh"               5 minutes ago  Up 5 minutes                   grafana_observability
If a container fails to start, refer to section Docker Container[s] Failed to Start for troubleshooting suggestions.
4.3.4. Configure Grafana
4.3.4.1. Initial Login
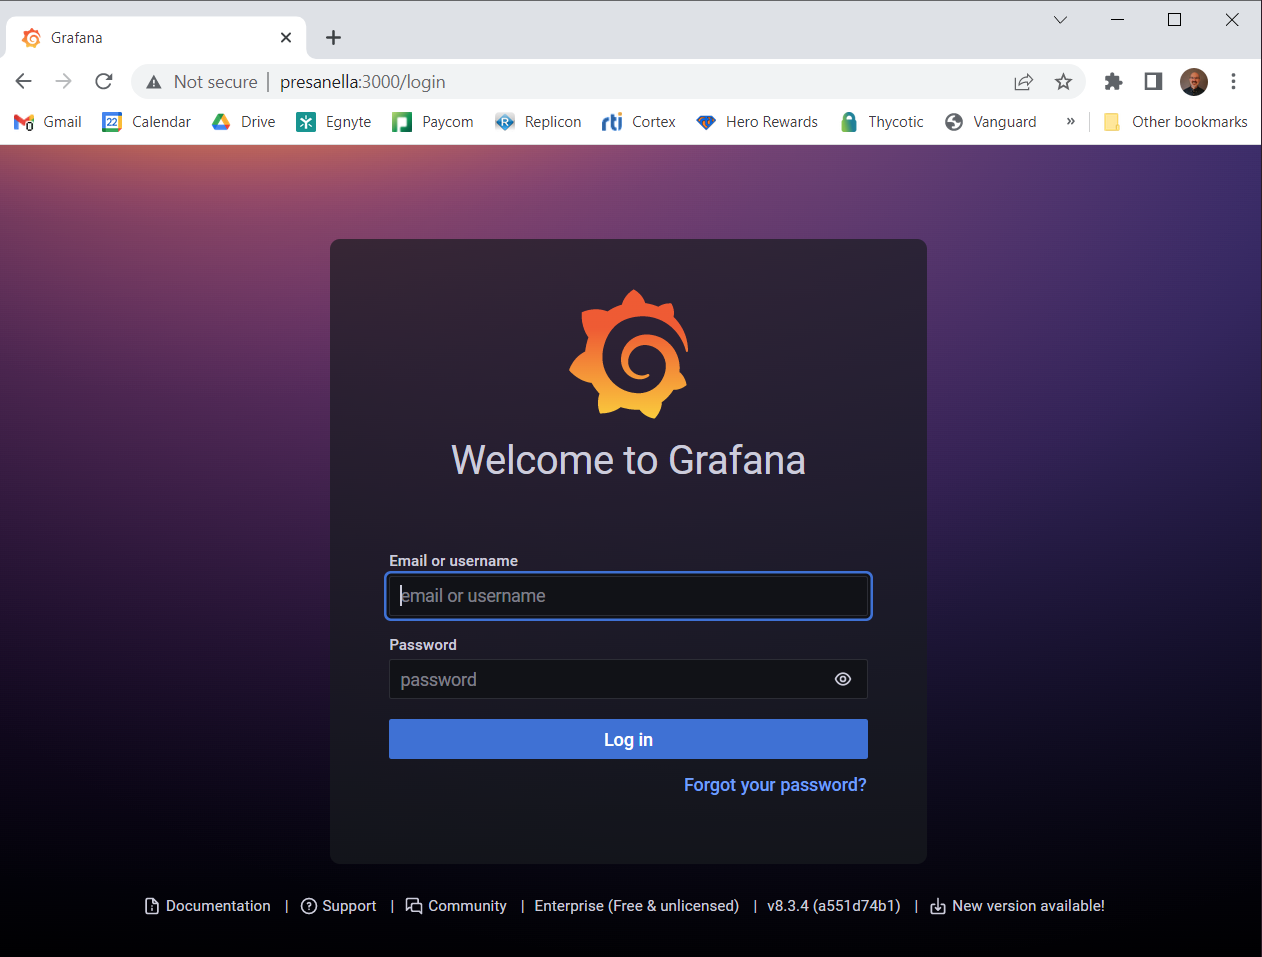
To access Observability Dashboards, open a new browser window and go to http://<hostname>:3000 to access Grafana. Log in using the credentials admin : admin, then change the password when prompted.
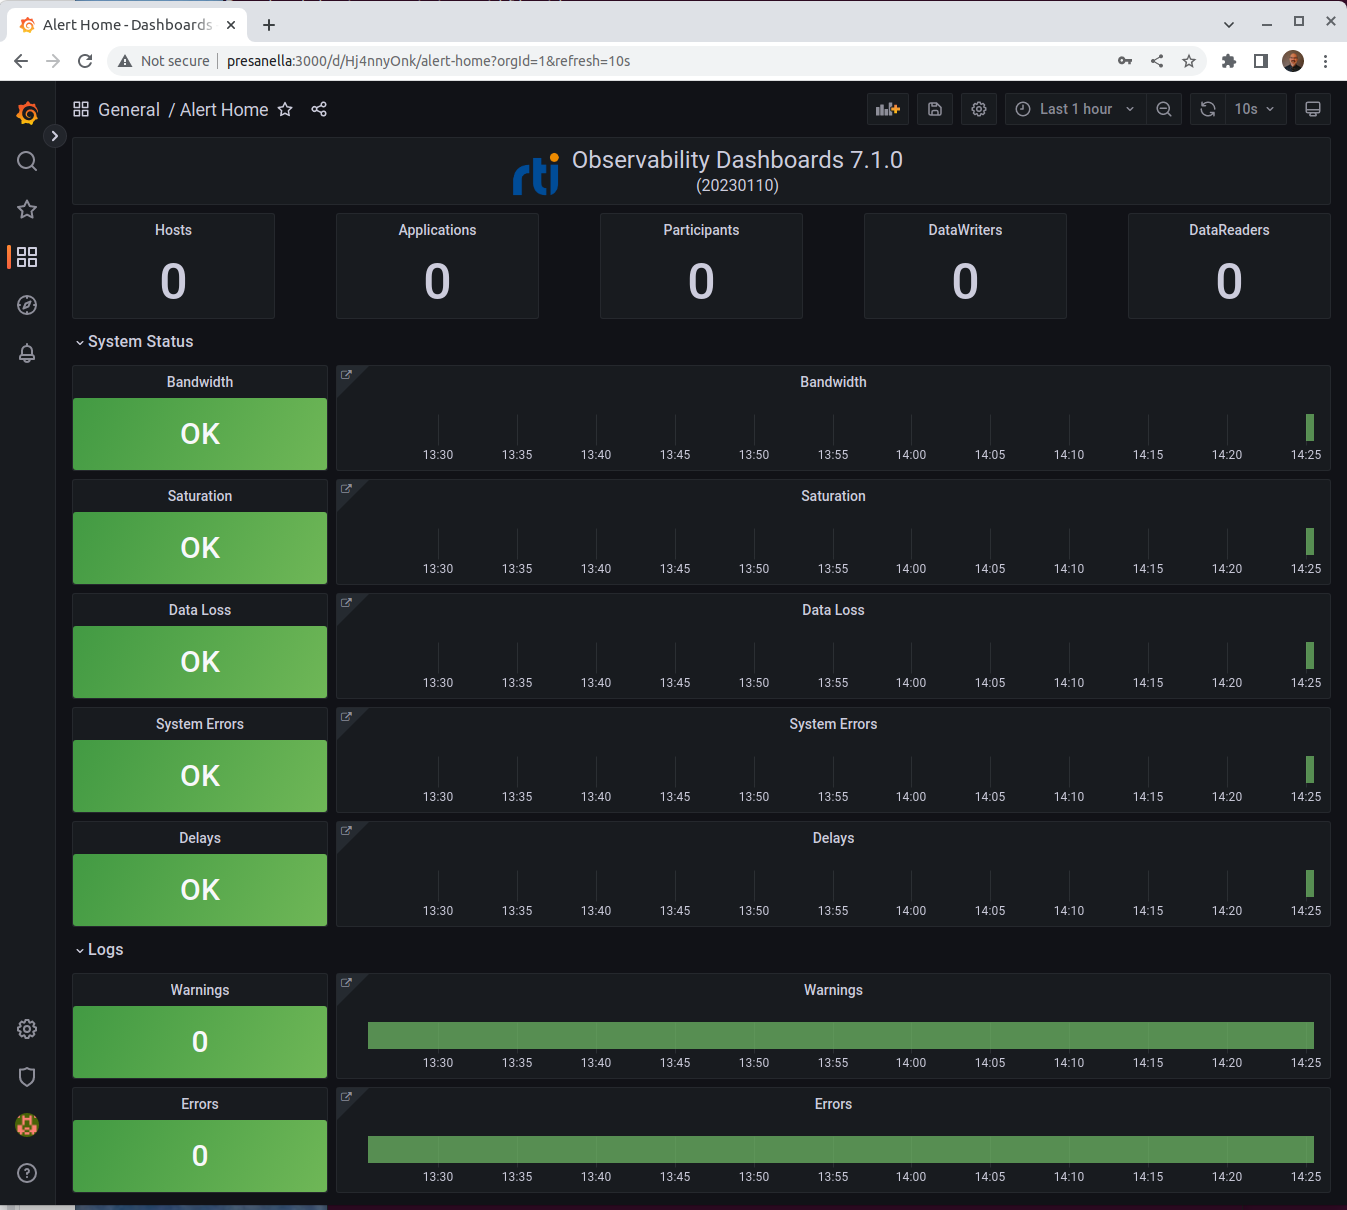
Once you are logged in you will see the RTI Alert Home dashboard.
4.3.4.2. Configuration Options
You can configure the Grafana dashboard to meet your specific needs. For more information, refer to the Grafana article Use dashboards.
4.3.4.2.1. Create Accounts (Optional)
You can create additional users as needed. Refer to the Grafana article Manage Grafana Users for information about user roles and permissions.
4.3.4.2.2. Change the Default Time Range (Optional)
The default visualization time range can be modified. The default relative time range is one hour. You may want to update the range as follows:
Go to the Alert Home dashboard,
From the toolbar, select the time picker.
Select the desired time range from the dropdown list. The dashboard refreshes to display the selected time range.
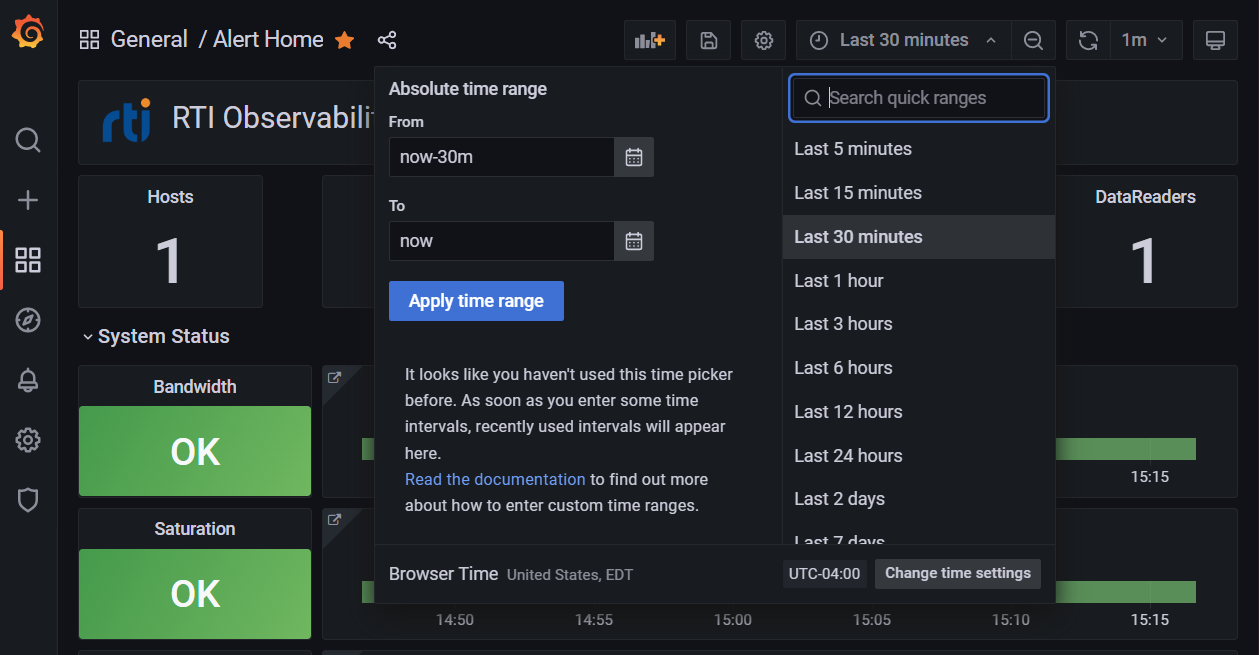
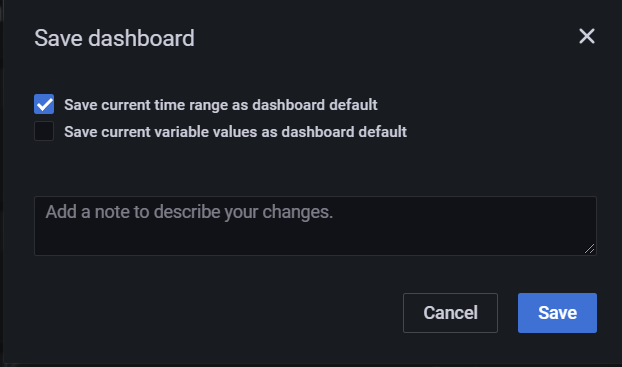
From the toolbar, select Save dashboard.
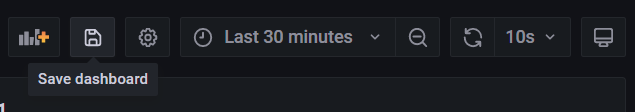
In the Save dashboard dialog, select Save current time range as dashboard default and then click Save.
To confirm the new time range, navigate to another dashboard and then click the Home icon at the top left to go back to the Alert Home dashboard.
4.3.5. Stop Docker Containers
Once Observability Framework Docker containers are running, you can
stop them by running <installdir>/bin/rtiobservability -t. The -t
option terminates the running Docker containers for*Observability Framework*
by calling docker compose stop.
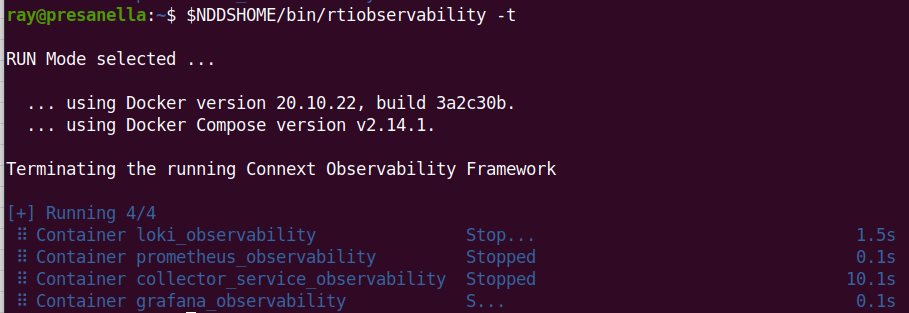
This command stops the existing Docker containers for*Observability Framework*, but leaves associated storage volumes and configuration for a future run.
4.3.6. Start Existing Docker Containers
To restart existing Docker containers used by Observability Framework,
run <installdir>/bin/rtiobservability -s. The -s option starts existing
Docker containers for Observability Framework by calling docker compose start.
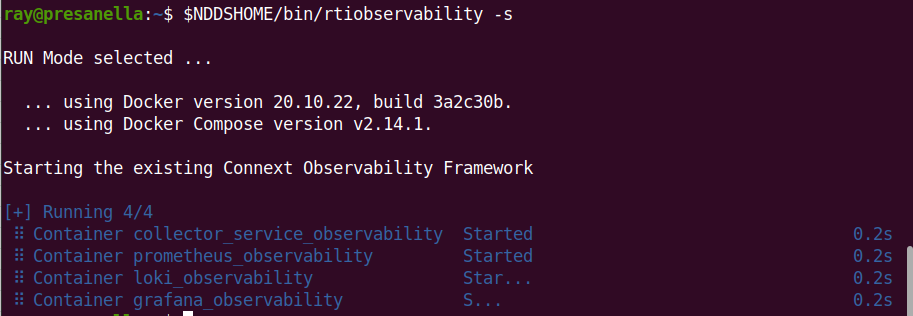
This command starts any existing Docker containers created by Observability Framework.
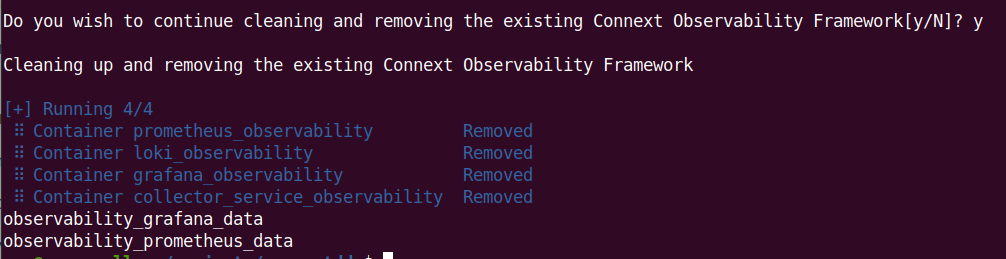
4.3.7. Stop and Remove Docker Containers
To clean up, or stop and remove, all Docker containers and storage volumes used
by Observability Framework, run <installdir>/bin/rtiobservability -c. The
-c option stops and removes Docker containers for Observability Framework
by calling docker compose down, and subsequently removes storage volumes.
Warning
Running <installdir>/bin/rtiobservability -c removes all Docker
containers and storage volumes
used by Observability Framework. This command removes all changes to
your current Observability Framework Docker environment including:
metric data in Prometheus
log data in Loki
all Grafana user and dashboard configurations
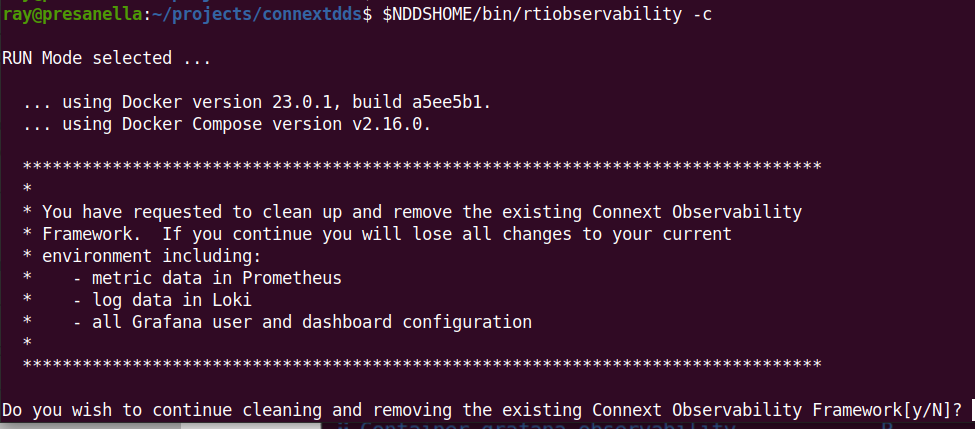
When prompted to confirm that you want to remove all Docker containers and storage volumes for Observability Framework:
Select
N(or simply enter) to cancel the cleanup.
Select
Yto proceed with the cleanup and remove all Docker containers and storage volumes used by Observability Framework.