2. Components
Connext Observability Framework consists of three RTI components:
RTI Monitoring Library 2.0 enables you to instrument a Connext application to forward telemetry data. The library also accepts remote commands to change the set of forwarded telemetry data at runtime.
RTI Observability Collector Service scalably collects telemetry data from multiple Connext applications and stores this data in a third-party observability backend. This component can also be configured to forward telemetry data to an OpenTelemetry Collector to allow integration with other third-party observability backends.
RTI Observability Dashboards enable you to visualize and alert based on the Connext application metrics, as well as display Connext log messages.
Observability Framework requires third-party components for storing and visualizing telemetry data. This release provides native integration with Prometheus for metrics storage, Grafana Loki for logs storage, and Grafana for visualization. Integration with other third-party components is also possible when using OpenTelemetry and the OpenTelemetry Collector.
RTI Observability Dashboards are provided as a set of Grafana dashboards to be deployed on a Grafana server. These dashboards only work with the Prometheus and Grafana Loki backends. Future releases could support other backends.
Figure 2.1 shows a simple representation of how Observability Framework components work together.
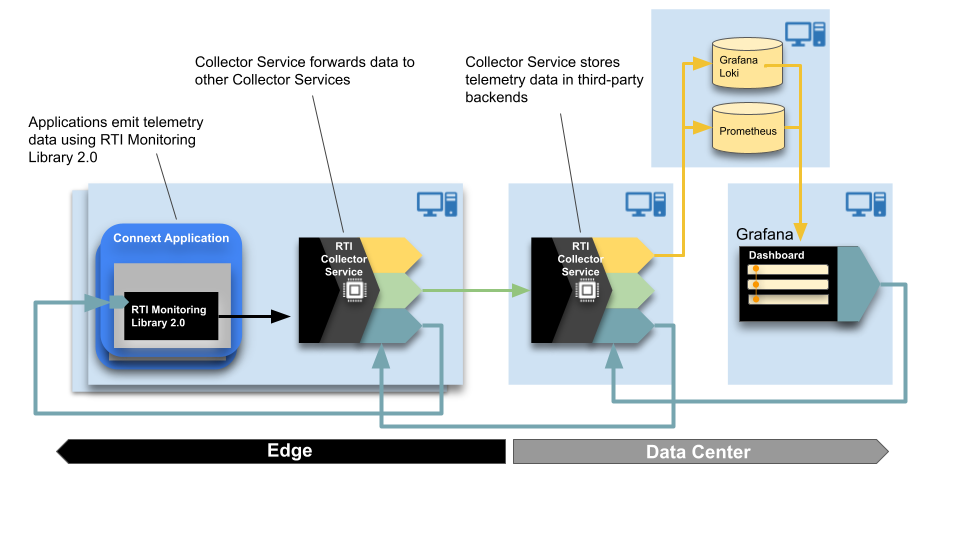
Figure 2.1 Observability Framework Components
2.1. Monitoring Library 2.0
Monitoring Library 2.0 includes the following key features:
Collection and forwarding of Connext metrics and logs. Logs for DDS Security events will be supported in future releases.
Configuration using a new MONITORING QosPolicy (DDS Extension). The QoS policy can be set programmatically or via XML.
Runtime changes to the set of generated and forwarded telemetry data using remote commands from Observability Collector Service. In this release, the library only allows you to change the forwarding and generation log verbosity levels for a Connext application.
Ability to enable and disable use of Monitoring Library 2.0 at runtime by changing the Monitoring QoS policy.
Lower overhead as compared to using the RTI Monitoring Library.
2.2. Observability Collector Service
Observability Collector Service scalably collects telemetry data forwarded by Monitoring Library 2.0 in a Connext application. Collector Service is distributed as a Docker™ image and can work in two modes:
Storage: Collector Service sends the telemetry data for storage to third-party observability backends. This release provides native integration with Prometheus for metrics and Grafana Loki for logs. Integration with other third-party components is also possible using OpenTelemetry and the OpenTelemetry Collector.
Forwarder: Collector Service forwards the telemetry data from a Connext application to other collector instances. This mode is not supported in the current release.
Observability Collector Service includes the following key features:
Collecting and filtering telemetry data forwarded by Connext applications (using Monitoring Library 2.0) or other collectors. This release does not provide filtering capabilities.
Sending telemetry data for storage to Prometheus for metrics and Grafana Loki for logs.
Ability to send telemetry data to an OpenTelemetry Collector using the OpenTelemetry protocol (OTLP). This feature enables integration with third-party observability backends other than Prometheus and Grafana Loki.
Remote command forwarding from Observability Dashboards to the Connext applications and other resources to which the commands are directed. This release only allows forwarding commands that change the logging verbosity of Connext applications. Future releases will support additional commands.
2.2.1. Storage Components
Observability Collector Service includes native integration with Prometheus and Grafana Loki to store metrics and logs, respectively.
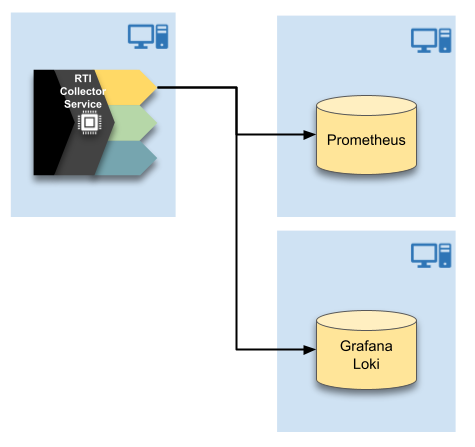
Figure 2.2 Native Integration
This release also allows integrating with other third-party storage components using OpenTelemetry and the OpenTelemetry Collector.
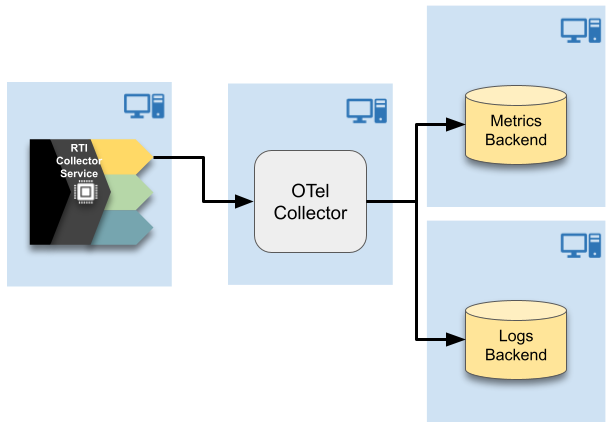
Figure 2.3 OpenTelemetry Integration
2.3. Observability Dashboards
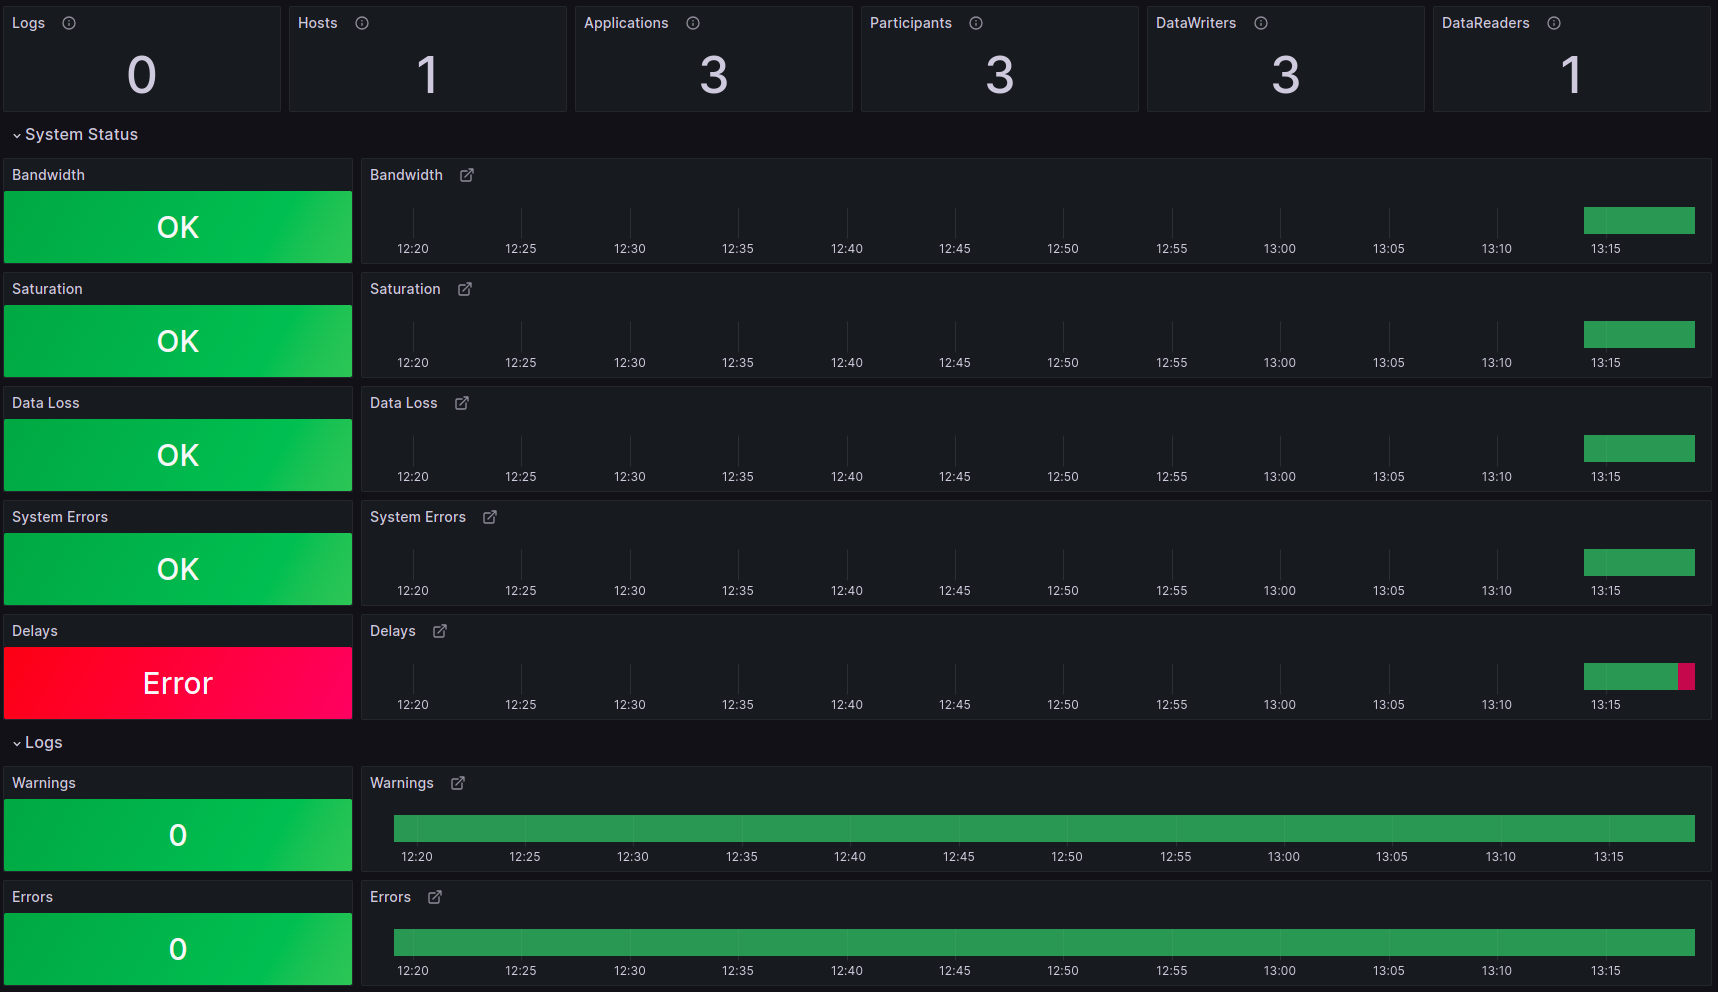
A set of hierarchical Grafana dashboards sends alerts when a problem occurs and provides visualizations to help perform root cause analysis. The dashboards get the telemetry data from a Prometheus server and the logs from a Grafana Loki server.
The first layer of the Grafana dashboards provides a health status summary focused on five golden signals: Bandwidth, Saturation, Data Loss, System Errors, and Delays.
The top-level dashboard also provides access to the system logs and indicates the number of entities running in the system. To get additional details on error conditions, select any of the golden signals displaying an error.
2.4. How We Provide the Components
This section describes how Observability Framework components are provided in the current release and how RTI will provide them in future releases.
2.4.1. Monitoring Library 2.0
Monitoring Library 2.0 is provided as a shared and static library called rtimonitoring2. For details on how to use the library, refer to Monitoring Library 2.0.
2.4.2. Collection, Storage, and Visualization Components
2.4.2.1. Current Release
2.4.2.1.1. Docker Compose (Prepackaged)
The Observability Framework package enables you to deploy and run Observability Collector Service and third-party components Prometheus, Grafana Loki, Grafana, OpenTelemetry Collector (optional), and NGINX (optional) using Docker Compose™ in a single Linux® host. For details, see Supported Docker Compose Environments.
RTI’s prepackaged Docker Compose installation option facilitates initial product evaluation because it does not require you to deploy all these components individually.
Observability Framework can be deployed with or without using the OpenTelemetry Collector. Both deployment options can be configured to be secure or non-secure and to work on a LAN or WAN.
Figure 2.4 shows the secure Observability Framework deployment without OpenTelemetry Collector. The deployment uses Prometheus and Grafana Loki to store metrics and logs, respectively.
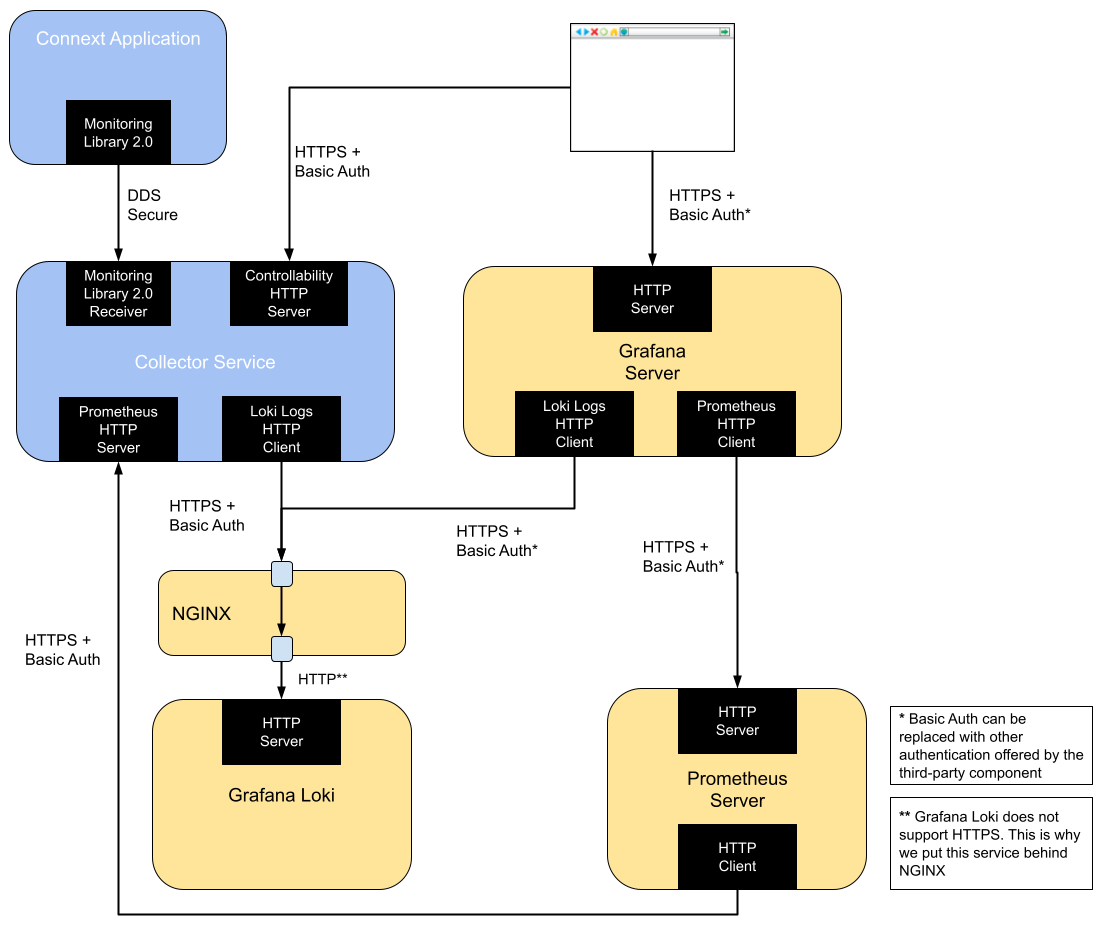
Figure 2.4 RTI Observability Framework without OpenTelemetry Collector
Figure 2.5 shows the secure Observability Framework deployment using OpenTelemetry Collector. The deployment uses OpenTelemetry Collector to store metrics and logs in Prometheus and Grafana Loki to store metrics and logs, respectively.
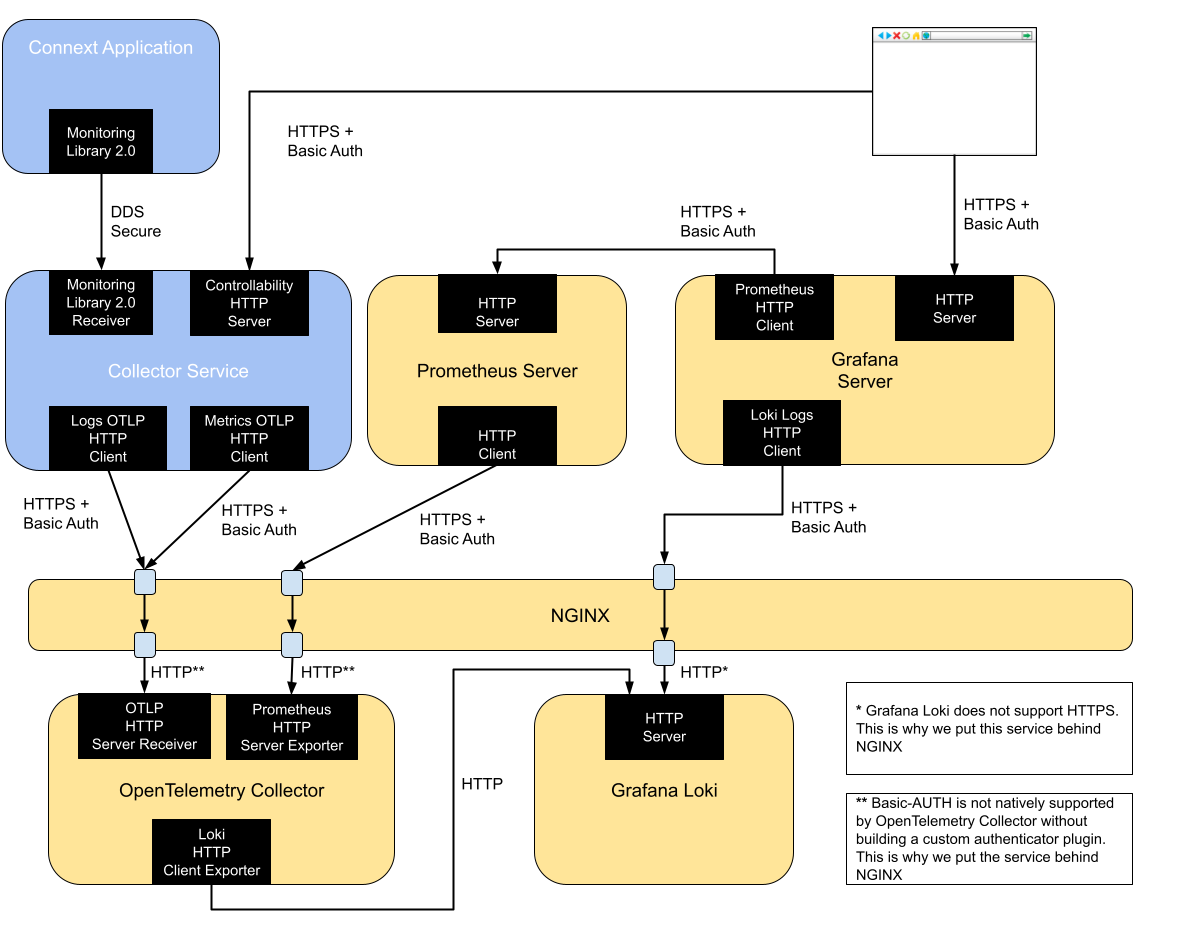
Figure 2.5 RTI Observability Framework with OpenTelemetry Collector
For additional information on how to use Docker Compose™ to run Observability Framework, see Configuring, Running, and Removing Observability Framework Components Using Docker Compose.
2.4.2.1.2. Docker (Separate Deployment)
As an alternative to the prepackaged Docker Compose provided by RTI, you can also run Observability Framework components standalone.
Observability Collector Service is distributed as a Docker image hosted in Dockerhub. This is the same publicly available image used by the prepackaged Docker Compose installation, and it requires a valid RTI license to run.
The Docker image included with Collector Service contains a built-in configuration that enables it to run in storage mode with the following operation modes:
Configuration Name |
Network |
Data Storage |
Security |
|---|---|---|---|
NonSecureLAN |
LAN |
Prometheus and Grafana Loki |
No |
NonSecureWAN |
WAN |
Prometheus and Grafana Loki |
No |
SecureLAN |
LAN |
Prometheus and Grafana Loki |
Yes |
SecureWAN |
WAN |
Prometheus and Grafana Loki |
Yes |
NonSecureOTelLAN |
LAN |
Multiple through OpenTelemetry Collector |
No |
NonSecureOTelWAN |
WAN |
Multiple through OpenTelemetry Collector |
No |
SecureOTelLAN |
LAN |
Multiple through OpenTelemetry Collector |
Yes |
SecureOTelWAN |
WAN |
Multiple through OpenTelemetry Collector |
Yes |
For additional information on how to use the Docker image included with Collector Service, refer to Docker’s Collector Service article.
The third-party components Prometheus, Grafana Loki, Grafana, OpenTelemetry Collector (Optional), and NGINX (Optional) are also distributed as Docker images by their respective vendors. You can use these images standalone instead of RTI’s prepackaged Docker Compose.
2.4.2.2. Future releases
2.4.2.2.1. Executable
In future releases, Collector Service will be provided as a standalone executable without using Docker to deploy.
2.4.2.2.2. Kubernetes
In future releases, the Docker images for Collector Service, Prometheus, Grafana Loki, and Grafana can be deployed on an orchestrated platform such as Kubernetes. RTI will provide example deployment configurations for these deployments when they are made available.