5. Installing and Running Observability Framework
RTI Connext Observability Framework is not installed as part of RTI Connext Professional Edition. Observability Framework must be downloaded and installed separately. For information on how to obtain the Observability Framework package, check the RTI Customer portal, contact support@rti.com, or contact your account team.
There are two Observability Framework packages, as outlined in Table 5.1.
Package Name |
Package Contents |
Use Case |
Supported Platform |
|---|---|---|---|
rti_observability-7.2.0-target-<your platform>.rtipkg |
The target package installs Monitoring Library 2.0 in your target platform(s). |
Install this package if you need to forward telemetry data generated by DDS applications on the target platform. |
Monitoring Library 2.0 is supported in all Connext platforms. |
rti_observability-7.2.0-host-x64Linux.rtipkg |
The host package contains the files required to run the Observability Framework collection, storage, and visualization components using Docker and Docker Compose. This package also includes Observability Framework documentation. |
Install this package if you need to run the collection, storage, and visualization components. |
These components are only supported in Linux. The host package can be installed on a Virtual Machine (VM); for more information, see Supported Docker Compose Environments. |
In the rest of this chapter, <installdir> refers to the installation
directory for Connext.
Important
Observability Framework is an experimental product that includes example configuration files for use with several third-party components (Prometheus, Grafana Loki, and Grafana). This release is an evaluation distribution; use it to explore the new observability features that support Connext applications.
Do not deploy any Observability Framework components in production.
5.1. Installing the Target Package
There are two ways to install Monitoring Library 2.0: using RTI Launcher
or the rtipkginstall command-line utility.
Note
For detailed information about Monitoring Library 2.0, see the MONITORING QosPolicy (DDS Extension).
5.1.1. Install from RTI Launcher
To install the Observability Framework target package from RTI Launcher:
Start Launcher from the Start menu, or from the command line using
<installdir>/bin/rtilauncher.From the Configuration tab, click Install RTI Packages.
Use the plus (+) sign to add the
rti_observability-<version>-target-<your platform>.rtipkgfile.Click Install.
5.1.2. Install from the Command Line
To install the Observability Framework target package from the command line, run:
$ <installdir>/bin/rtipkginstall /<path-to-observability-framework-file>/rti_observability-<version>-target-<your platform>.rtipkg
5.2. Installing the Host Package
There are two ways to install the documentation and files supporting the
Docker containers used by Observability Framework: using RTI Launcher
or the rtipkginstall command-line utility.
5.2.1. Prerequisites
The following applications must be installed before installing the experimental Observability Framework product.
Connext 7.2.0. For installation instructions, see the RTI Connext Installation Guide.
Docker Engine v20.10.x or higher. For installation instructions, see Docker’s Engine installation overview.
Docker Compose Plugin v2.x or higher. For installation instructions, see Docker’s installation instructions.
Note
The Observability Framework host package has been tested on the platforms noted in Supported Docker Compose Environments.
5.2.2. Install from RTI Launcher
To install the Observability Framework host package from RTI Launcher:
Start Launcher from the Start menu, or from the command line using:
<installdir>/bin/rtilauncher.From the Configuration tab, click Install RTI Packages.
Use the plus (+) sign to add the
rti_observability-<version>-host-x64Linux.rtipkgfile.Click Install.
5.2.3. Install from the Command Line
To install the Observability Framework host package from the command line, run:
$ <installdir>/bin/rtipkginstall /<path-to-observability-framework-file>/rti_observability-<version>-host-x64Linux.rtipkg
5.3. Configuring, Running, and Removing Observability Framework Components Using Docker Compose
The telemetry data forwarded by Monitoring Library 2.0 is processed, stored, and visualized using the following components:
OpenTelemetry Collector [Optional]: Observability Framework can be configured to launch an instance of OpenTelemetry Collector that will store the telemetry data in Prometheus and Loki instead of this being done by the RTI Observability Collector Service. In this configuration mode, RTI Observability Collector Service sends the data to OpenTelemetry Collector.
NGINX [Optional]: when using security the Observability Framework runs and instance of NGINX to secure communications with Grafana Loki and the OpenTelemetry Collector.
The files required to run these components are installed by the Observability Framework host package. In this release, the collection, storage, and visualization components only run in a single Linux host using Docker and Docker Compose. Future releases will offer the ability to install the components independently without using Docker.
Observability Framework can be deployed with or without using the OpenTelemetry Collector. Both deployment options can be configured to be secure or non-secure and to work on a LAN or WAN. For additional information on the deployment options, see Docker Compose (Prepackaged).
Warning
Observability Framework uses third-party software that is subject to each product’s license terms and conditions. IT IS YOUR RESPONSIBILITY TO ENSURE THAT YOUR USE OF THIRD-PARTY SOFTWARE COMPLIES WITH THE CORRESPONDING THIRD-PARTY LICENSE TERMS AND CONDITIONS.
5.3.1. Configuring the Docker Workspace for Observability Framework
Before creating and running the Docker containers for Observability
Framework, the associated configuration files that comprise the Docker
workspace must be created and copied to the
rti_workspace/<version>/user_config/observability directory. This is done using
the <installdir>/bin/rtiobservability script.
There are several optional, user-defined variables you can use to configure Observability Framework. These variables are specified in a JSON file.
Note
To reconfigure an existing Docker workspace you must first remove the existing workspace as described in section Removing the Docker Workspace for Observability Framework.
5.3.1.1. Configure the JSON File
Before creating your workspace, you will need to provide your configuration using a JSON file. This file can contain all the specific ports, names, and certificates to be used by the different services.
The following default JSON file is included in the installation folder at
<rti_installation>/resource/app/app_support/observability/default.json. You
can copy this file to another location, then modify it as needed to create
the Observability Framework configuration for your environment. Alternately,
you can create your own JSON file.
{
  "hostname": "localhost",
  "observabilityDomain": 2
}
The following table describes all the fields you can configure:
Field Name |
Description |
Type |
Default Value |
|---|---|---|---|
hostname |
Hostname to be used to configure all of the services. This field is required. |
String |
N/A |
observabilityDomain |
DDS Domain to be used to exchange Observability data. |
int |
2 |
lgpStackConfig |
|||
lgpStackConfig.grafanaPort |
The Grafana server port. |
int |
3000 |
lgpStackConfig.prometheusPort |
The Prometheus server port. |
int |
9090 |
lgpStackConfig.lokiPort |
The Loki server port. |
int |
3100 |
collectorConfig |
|||
collectorConfig.prometheusExporterPort |
The Collector Service client port for Prometheus data. |
int |
19090 |
collectorConfig.controlPort |
The Collector Service server port for control commands. |
int |
19098 |
collectorConfig.rtwPort |
WAN port used by RTI Real-Time Wan Transport. |
int |
30000 |
otelConfig |
|||
otelConfig.otelHttpReceiverPort |
Port used to configure OpenTelemetry http receiver port. |
int |
|
securityConfig |
|||
securityConfig.basicAuthUsername |
Username used for HTTP Basic authentication. |
String |
|
securityConfig.basicAuthPassword |
Password used for HTTP Basic authentication. |
String |
|
securityConfig.httpsSecurity |
|||
securityConfig.httpsSecurity.caCertificate |
Certificate authority (CA) used to verify the SSL certificates signed by this CA. |
String |
|
securityConfig.httpsSecurity.serverCertificate |
Server Certificate used with HTTPs. |
String |
|
securityConfig.httpsSecurity.serverKey |
Server Key for the Server Certificate. |
String |
|
securityConfig.ddsSecurity |
|||
securityConfig.ddsSecurity.identityCaCertificate |
File to be passed as |
String |
|
securityConfig.ddsSecurity.permissionsCaCertificate |
File to be passed as |
String |
|
securityConfig.ddsSecurity.identityCertificate |
File to be passed as |
String |
|
securityConfig.ddsSecurity.identityKey |
File to be passed as |
String |
|
securityConfig.ddsSecurity.signedPermissionsFile |
File to be passed as |
String |
|
securityConfig.ddsSecurity.signedGovernanceFile |
File to be passed as |
String |
All the fields are optional except hostname. If securityConfig is
provided, then all its fields must be provided as well.
Complete examples of both secure and non-secure configurations of the Observability Framework may be found in the section Configure Observability Framework for the Appropriate Operation Mode of the Getting started Guide.
An example of a fully-defined JSON file, with security and OpenTelemetry configured, follows. You can follow this example to create your own custom configuration.
{
   "hostname": "localhost",
   "observabilityDomain": 2,
   "lgpStackConfig": {
      "grafanaPort": 3000,
      "prometheusPort": 9090,
      "lokiPort": 3100
   },
   "collectorConfig": {
      "prometheusExporterPort": 19090,
      "controlPort": 19098
   },
   "otelConfig": {
      "otelHttpReceiverPort": 4318
   },
   "securityConfig": {
     "basicAuthUsername": "yourusername",
     "basicAuthPassword": "yourpassword",
     "httpsSecurity": {
         "caCertificate": "path/to/ca_cert.pem",
         "serverCertificate": "path/to/server_cert.pem",
         "serverKey": "path/to/server_key.pem"
     }
      "ddsSecurity": {
             "identityCaCertificate":    "path/to/identityCaCert.pem",
             "permissionsCaCertificate": "path/to/permissionsCaCert.pem",
             "identityCertificate":      "path/to/identityCert.pem",
             "identityKey":              "path/to/identityKey.pem",
             "signedPermissionsFile":    "path/to/signedPermissions.p7s",
             "signedGovernanceFile":     "path/to/signedGovernance.p7s"
      }
   }
}
Note
The tilde (~) Linux shortcut for a user home directory is not supported in the JSON configuration file.
5.3.1.2. Run the Observability script to create the Observability workspace
To configure the Docker workspace for Observability Framework, run the
<installdir>/bin/rtiobservability script with the -c <json_file> option.
Warning
The <installdir>/bin/rtiobservability script requires Python3. If any
Python package dependencies are missing, the script detects them and provides
the command to install them. The required packages are detailed in the
<installdir>/resource/app/app_support/observability/requirements.txt file.
The following image shows the types of errors returned when running the
script with a missing dependency.
$ rtiobservability -c NonSecureLAN.json

********************************************************************************
*
* The Observability Docker Containers created by this script may include images
* from third-parties, including:
*
*    Prometheus
*      (https://hub.docker.com/r/prom/prometheus)
*    Grafana Loki
*      (https://hub.docker.com/r/grafana/loki)
*    Grafana
*      (https://hub.docker.com/r/grafana/grafana-enterprise)
*    NGINX
*      (https://hub.docker.com/_/nginx)
*    OpenTelemetry Collector
*      (https://hub.docker.com/r/otel/opentelemetry-collector-contrib)
*
* Such third-party software is subject to third-party license terms and
* conditions. IT IS YOUR RESPONSIBILITY TO ENSURE THAT YOUR USE OF THIRD-PARTY
* SOFTWARE COMPLIES WITH THE CORRESPONDING THIRD-PARTY LICENSE TERMS AND
* CONDITIONS.
*
********************************************************************************

Do you wish to continue setting up the Connext Observability Framework[Y/n]? Y

Generating configuration for the Connext Observability Framework

2023-08-03 01:36:46,017 - root - ERROR - Some requirements are missing: No module named 'jinja2'.
2023-08-03 01:36:46,017 - root - ERROR - Please install them with the following command:
    pip3 install -r /home/test/rti_connext_dds-7.2.0/resource/app/app_support/observability/requirements.txt
Run
<installdir>/bin/rtiobservability -c <json_file>to configure the Docker workspace.$ rtiobservability -c NonSecureLAN.json ******************************************************************************** * * The Observability Docker Containers created by this script may include images * from third-parties, including: * * Prometheus * (https://hub.docker.com/r/prom/prometheus) * Grafana Loki * (https://hub.docker.com/r/grafana/loki) * Grafana * (https://hub.docker.com/r/grafana/grafana-enterprise) * NGINX * (https://hub.docker.com/_/nginx) * OpenTelemetry Collector * (https://hub.docker.com/r/otel/opentelemetry-collector-contrib) * * Such third-party software is subject to third-party license terms and * conditions. IT IS YOUR RESPONSIBILITY TO ENSURE THAT YOUR USE OF THIRD-PARTY * SOFTWARE COMPLIES WITH THE CORRESPONDING THIRD-PARTY LICENSE TERMS AND * CONDITIONS. * ******************************************************************************** Do you wish to continue setting up the Connext Observability Framework[Y/n]?
Select
Y/y(or simply enter) to acknowledge the license statement.Do you wish to continue setting up the Connext Observability Framework[Y/n]? y Generating configuration for the Connext Observability Framework 2023-07-19 19:28:10,277 - exporter - INFO - Config: { "hostname": "localhost", "observabilityDomain": 2, "otelConfig": null, "lgpStackConfig": { "grafanaPort": 3000, "prometheusPort": 9090, "lokiPort": 3100 }, "collectorConfig": { "prometheusExporterPort": 19090, "controlPort": 19098, "rtwPort": null }, "securityConfig": null }
If you attempt to configure an existing Docker workspace for Observability Framework, you will see the following warning.
$ rtiobservability -c NonSecureOTelLAN.json

  ********************************************************************************
  *
  *  The Connext Observability Framework already exist in:
  *      /home/rtrentini/rti_workspace/7.2.0/user_config/observability
  *
  *  Remove or rename the directory manually if you want to start over ...
  *
  ********************************************************************************
5.3.2. Initialize and Run Docker Containers
Important
An RTI license is always required to run Observability Collector Service in a Docker container. The following table indicates the RTI licenses required based on your answers to the questions in the first two columns.
Do you need to secure telemetry data exchanged between applications and Collector Service using RTI Security Plugins? |
Do you need to send telemetry data to Collector Service over the WAN using RTI Real-Time WAN Transport? |
Required License |
|---|---|---|
NO |
NO |
Connext Professional |
YES |
NO |
Connext Secure |
YES |
YES |
Connext Anywhere |
NO |
YES |
Connext Anywhere |
For instructions on how to install a license file, see Installing the License File in the RTI Connext Installation Guide.
After the Docker workspace is configured and created, run
<installdir>/bin/rtiobservability -i to initialize and run the Docker
containers for Observability Framework. The -i option calls
docker compose up -d to create the required
storage volumes and containers, then starts the containers.
$ rtiobservability -i

  ... using Docker version 24.0.4, build 3713ee1.
  ... using Docker Compose version v2.19.1.

Initializing and running the Connext Observability Framework

[+] Running 6/6
✔ Volume "observability_grafana_data"        Created                                                       0.0s
✔ Volume "observability_prometheus_data"     Created                                                       0.0s
✔ Container collector_service_observability  Started                                                       0.2s
✔ Container prometheus_observability         Started                                                       0.2s
✔ Container grafana_observability            Started                                                       0.2s
✔ Container loki_observability               Started                                                       0.2s
Three things happen upon running <installdir>/bin/rtiobservability
with the -i option.
The Docker images for Grafana Loki, Prometheus, Grafana, and Observability Collector Service are pulled from Docker Hub to your local Docker image store. Note that this will only happen if there are no local images found.
The Docker data volumes are created for the Prometheus and Grafana data storage.
Docker containers for Observability Framework are started for the four components (Loki, Prometheus, Grafana, and Observability Collector Service).
At this point, the Docker containers used by Observability Framework are started and all components should be running.
5.3.3. Verify Docker Containers are Running
To verify that all Docker containers used by Observability Framework are
running, run the command docker ps -a. Examine the STATUS column and
verify that all containers report a status of Up, as shown below.
CONTAINER ID  IMAGE                                    COMMAND                 CREATED        STATUS        NAMES
6651d7ed9810  prom/prometheus:v2.37.5                  "/bin/prometheus --c…"  5 minutes ago  Up 5 minutes  prometheus_observability
25050d16b1b5  grafana/grafana-enterprise:9.2.1-ubuntu  "/run.sh"               5 minutes ago  Up 5 minutes  grafana_observability
08611ea9b255  rticom/collector-service:<version>       "/rti_connext_dds-7.…"  5 minutes ago  Up 5 minutes  collector_service_observability
55568de5120f  grafana/loki:2.7.0                       "/usr/bin/loki --con…"  5 minutes ago  Up 5 minutes  loki_observability
When a container does not start,
the STATUS column displays Restarting to indicate the
prometheus-observability container failed to start and repeatedly tried
to restart.
CONTAINER ID  IMAGE                                    COMMAND                 CREATED        STATUS                         NAMES
08f75e0fadb2  prom/prometheus:v2.37.5                  "/bin/prometheus --c…"  5 minutes ago  Restarting (1) 27 seconds ago  prometheus_observability
9a3964b561ec  grafana/loki:2.7.0                       "/usr/bin/loki --con…"  5 minutes ago  Up 5 minutes                   loki_observability
b6a6ffa201f3  rticom/collector-service:<version>       "/rti_connext_dds-7.…"  5 minutes ago  Up 5 minutes                   collector_service_observability
26658f76cfdc  grafana/grafana-enterprise:9.2.1-ubuntu  "/run.sh"               5 minutes ago  Up 5 minutes                   grafana_observability
If a container fails to start, refer to section Docker Container[s] Failed to Start for troubleshooting suggestions.
5.3.4. Configure Grafana
5.3.4.1. Initial Login
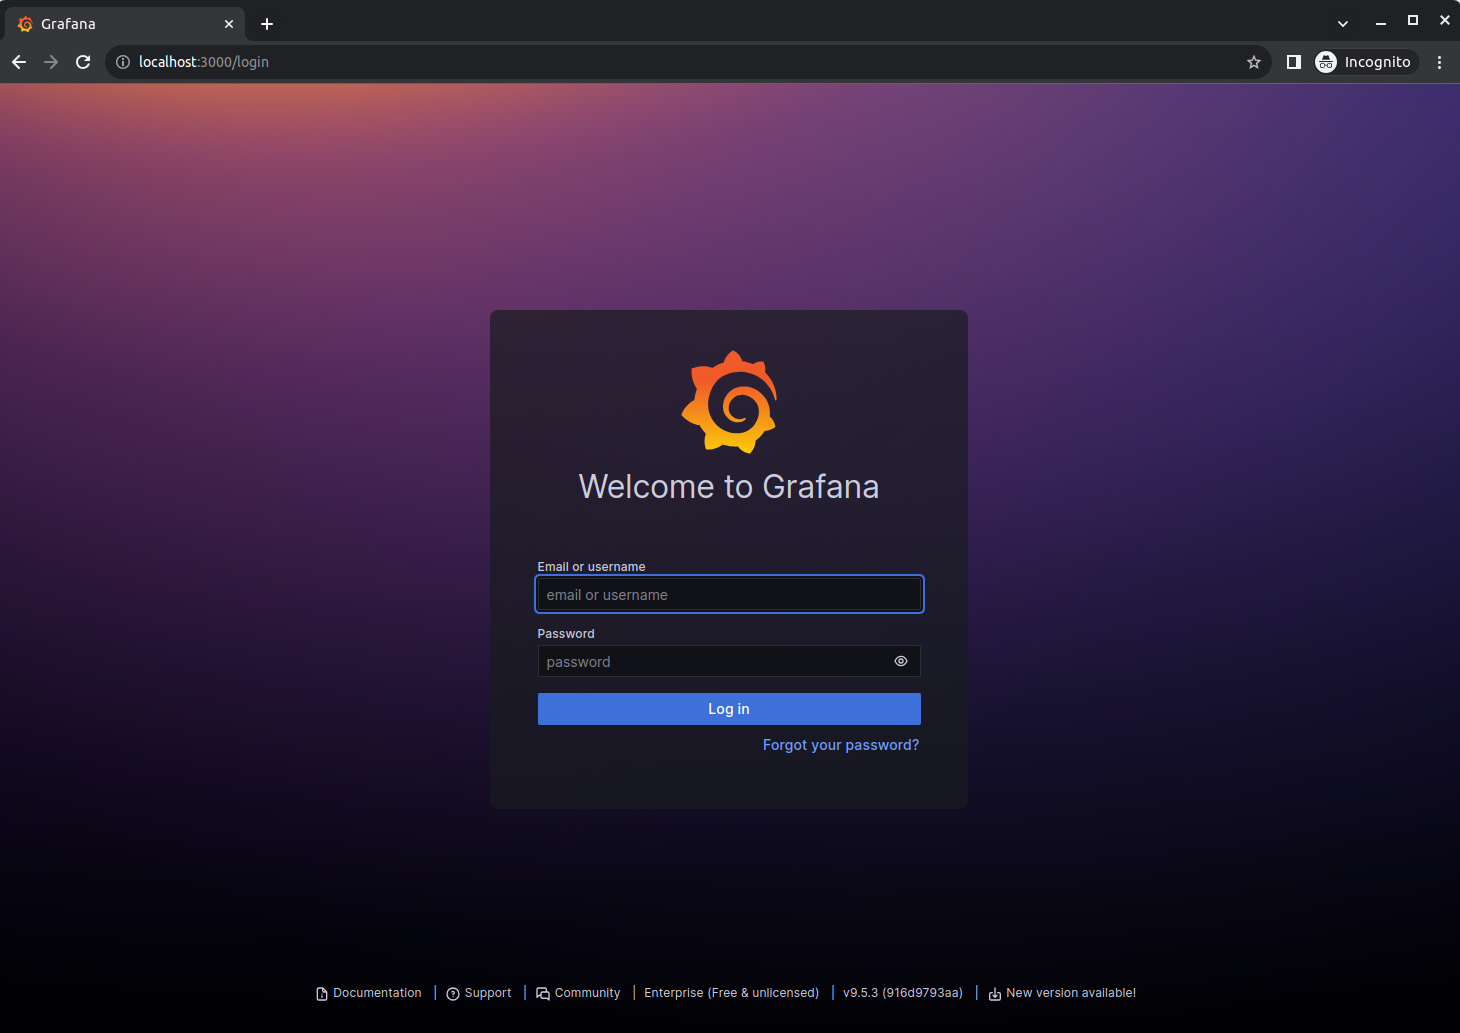
To access Observability Dashboards, open a new browser window and go to http://<hostname>:<grafanaPort> to access Grafana (3000 is the default grafanaPort). Log in using the credentials admin : admin, then change the password when prompted.
If you are using a secure configuration, the url to access Grafana will be https://<hostname>:<grafanaPort> and the Grafana credentials will be the values configured in the basicAuthUsername and basicAuthPassword fields in the JSON configuration.
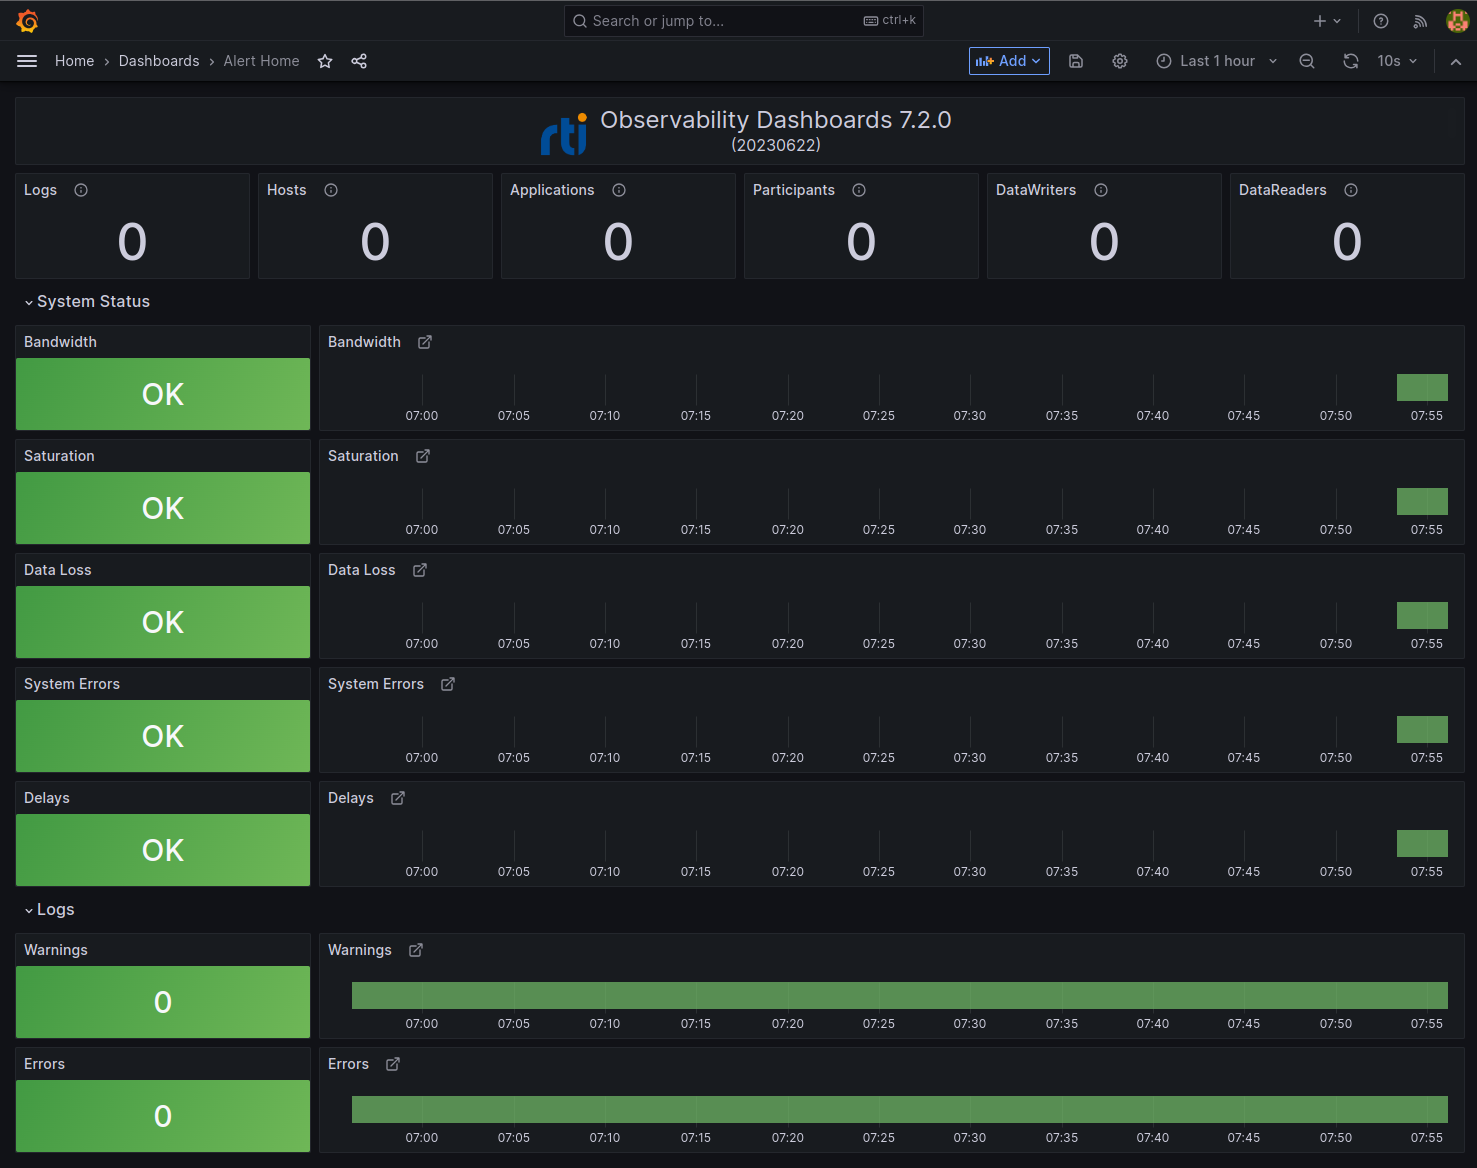
Once you are logged in you will see the RTI Alert Home dashboard.
5.3.4.2. Configuration Options
You can configure the Grafana dashboard to meet your specific needs. For more information, refer to the Grafana article Use dashboards.
5.3.4.2.1. Create Accounts (Optional)
You can create additional users as needed. Refer to the Grafana article Manage Grafana Users for information about user roles and permissions.
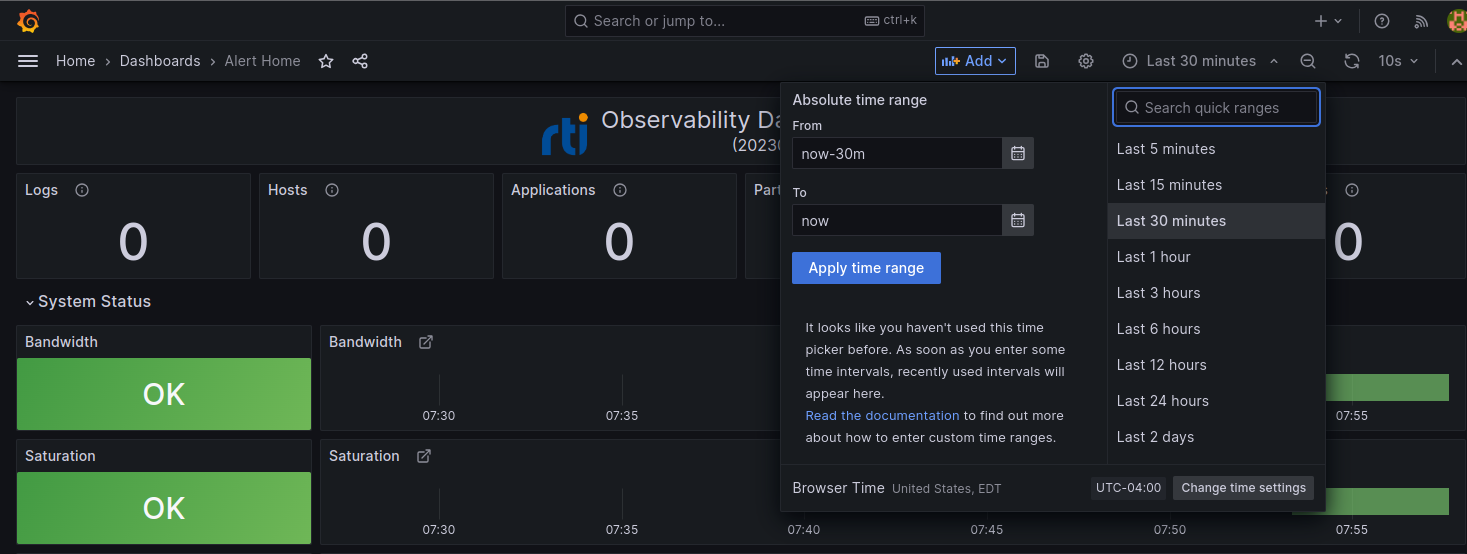
5.3.4.2.2. Change the Default Time Range (Optional)
The default visualization time range can be modified. The default relative time range is one hour. You may want to update the range as follows:
Go to the Alert Home dashboard,
From the toolbar, select the time picker.
Select the desired time range from the dropdown list. The dashboard refreshes to display the selected time range.
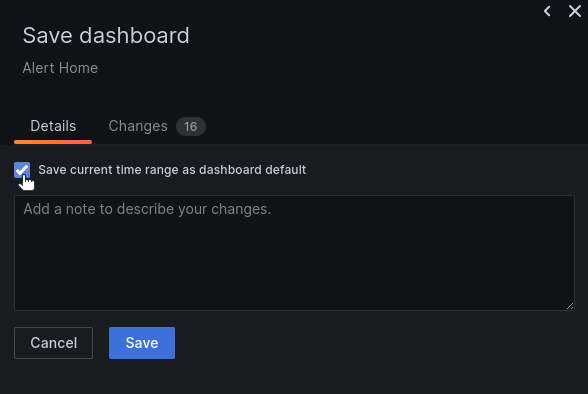
From the toolbar, select Save dashboard.
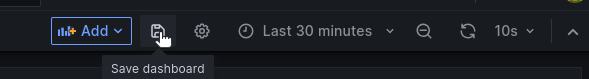
In the Save dashboard dialog, select Save current time range as dashboard default and then click Save.
To confirm the new time range, navigate to another dashboard and then click the Home icon at the top left to go back to the Alert Home dashboard.
5.3.5. Stop Docker Containers
Once Observability Framework Docker containers are running, you can
stop them by running <installdir>/bin/rtiobservability -t. The -t
option terminates the running Docker containers for*Observability Framework*
by calling docker compose stop.
$ rtiobservability -t

  ... using Docker version 24.0.4, build 3713ee1.
  ... using Docker Compose version v2.19.1.

Terminating the running Connext Observability Framework

[+] Stopping 4/4
✔ Container collector_service_observability  Stopped                                                      10.1s
✔ Container prometheus_observability         Stopped                                                       0.1s
✔ Container grafana_observability            Stopped                                                       0.2s
✔ Container loki_observability               Stopped                                                       2.1s
This command stops the existing Docker containers for*Observability Framework*, but leaves associated storage volumes and configuration for a future run.
5.3.6. Start Existing Docker Containers
To restart existing Docker containers used by Observability Framework,
run <installdir>/bin/rtiobservability -s. The -s option starts existing
Docker containers for Observability Framework by calling docker compose start.
$ rtiobservability -s

  ... using Docker version 24.0.4, build 3713ee1.
  ... using Docker Compose version v2.19.1.

Starting the existing Connext Observability Framework

[+] Running 4/4
✔ Container prometheus_observability         Started                                                       0.1s
✔ Container collector_service_observability  Started                                                       0.1s
✔ Container grafana_observability            Started                                                       0.1s
✔ Container loki_observability               Started                                                       0.2s
This command starts any existing Docker containers created by Observability Framework.
5.3.7. Stop and Remove Docker Containers
To clean up, or stop and remove, all Docker containers and storage volumes used
by Observability Framework, run <installdir>/bin/rtiobservability -d. The
-d option stops and removes Docker containers for Observability Framework
by calling docker compose down, and subsequently removes storage volumes.
Warning
Running <installdir>/bin/rtiobservability -d removes all Docker
containers and storage volumes
used by Observability Framework. This command removes all changes to
your current Observability Framework Docker environment including:
metric data in Prometheus
log data in Loki
all Grafana user and dashboard configurations
$ rtiobservability -d

  ... using Docker version 24.0.4, build 3713ee1.
  ... using Docker Compose version v2.19.1.

  ********************************************************************************
  *
  * You have requested to clean up and remove the existing Connext Observability
  * Framework.  If you continue you will lose all changes to your current
  * environment including:
  *    - metric data in Prometheus
  *    - log data in Loki
  *    - all Grafana user and dashboard configuration
  *
  ********************************************************************************

Do you wish to continue cleaning and removing the existing Connext Observability Framework[y/N]?
When prompted to confirm that you want to remove all Docker containers and storage volumes for Observability Framework:
Select
N/n(or simply enter) to cancel the cleanup.
Do you wish to continue cleaning and removing the existing Connext Observability Framework[y/N]? n

Cleaning up and removing the existing Connext Observability Framework canceled.
Select
Y/yto proceed with the cleanup and remove all Docker containers and storage volumes used by Observability Framework.
Do you wish to continue cleaning and removing the existing Connext Observability Framework[y/N]? y

Cleaning up and removing the existing Connext Observability Framework

[+] Running 4/5
✔ Container prometheus_observability         Removed                                                           0.1s
✔ Container grafana_observability            Removed                                                           0.1s
✔ Container loki_observability               Removed                                                           1.5s
✔ Container collector_service_observability  Removed                                                          10.1s
observability_grafana_data
observability_prometheus_data
5.3.8. Removing the Docker Workspace for Observability Framework
There may be a time that you need to remove your existing Docker Workspace for
Observability Framework. This could be because you want to change the existing
configuration in some way. Things that you would want to change could include
hostname, port configurations, and enabling or disabling security. The rtiobservability
script will not overwrite an existing workspace. This prevents inadvertently
corrupting or deleting an existing configuration. The following steps should be
followed to remove an existing workspace to allow re-configuration.
You must first stop and remove any existing containers created with the current workspace configuration as detailed in section Stop and Remove Docker Containers.
Once the docker containers have been stopped and removed you must manually delete the
rti_workspace/<version>/user_config/observabilitydirectory.$ rm -rf <path_to_workspace>/<version>/user_config/observability