9. Troubleshooting Observability Framework
This section provides solutions for issues you may run into while evaluating Observability Framework.
9.1. Docker Container[s] Failed to Start
The Docker containers used by Observability Framework can fail to start for a
variety of reasons. Two common reasons for this are port conflicts or illegal
file permissions. To verify the state of these Docker containers, run the Docker
command docker ps -a.
An example that shows all Docker containers used by Observability Framework have successfully started is shown below.
CONTAINER ID  IMAGE                                    COMMAND                 CREATED        STATUS        NAMES
6651d7ed9810  prom/prometheus:v2.37.5                  "/bin/prometheus --c…"  5 minutes ago  Up 5 minutes  prometheus_observability
25050d16b1b5  grafana/grafana-enterprise:9.2.1-ubuntu  "/run.sh"               5 minutes ago  Up 5 minutes  grafana_observability
08611ea9b255  rticom/collector-service:<version>       "/rti_connext_dds-7.…"  5 minutes ago  Up 5 minutes  collector_service_observability
55568de5120f  grafana/loki:2.7.0                       "/usr/bin/loki --con…"  5 minutes ago  Up 5 minutes  loki_observability
An example that shows a container that has failed to start is shown below. The
failure is indicated by the Restarting note in the STATUS column. In this example, the
prometheus-observability container failed to start and repeatedly tried
to restart.
CONTAINER ID  IMAGE                                    COMMAND                 CREATED        STATUS                         NAMES
08f75e0fadb2  prom/prometheus:v2.37.5                  "/bin/prometheus --c…"  5 minutes ago  Restarting (1) 27 seconds ago  prometheus_observability
9a3964b561ec  grafana/loki:2.7.0                       "/usr/bin/loki --con…"  5 minutes ago  Up 5 minutes                   loki_observability
b6a6ffa201f3  rticom/collector-service:<version>       "/rti_connext_dds-7.…"  5 minutes ago  Up 5 minutes                   collector_service_observability
26658f76cfdc  grafana/grafana-enterprise:9.2.1-ubuntu  "/run.sh"               5 minutes ago  Up 5 minutes                   grafana_observability
To determine why a container failed, examine its log file. To generate
the log, run the Docker command docker logs <container-name>
where <container_name> is specified in the NAMES column, as shown above.
9.1.1. Check for Port Conflicts
Run docker logs <container-name> to generate the logs for the failed container,
then look for a port conflict error. An example of a Prometheus
port conflict is shown below.
ts=2023-03-14T13:12:29.275Z caller=web.go:553 level=info component=web msg="Start listening for connections" address=0.0.0.0:9090
ts=2023-03-14T13:12:29.275Z caller=main.go:786 level=error msg="Unable to start web listener" err="listen tcp 0.0.0.0:9090: bind: address already in use"
If you discover port conflicts, perform the following steps to resolve the issue.
Remove the existing Observability Workspace. See Removing the Docker Workspace for Observability Framework for details on how to remove the workspace.
Update the JSON configuration files to configure ports. See Configuring the Docker Workspace for Observability Framework for details on how to update the port configuration for the failed container.
Run
<installdir>/bin/rtiobservability -c <JSON config>to recreate the Obervability Workspace with the new port configuration.Run
<installdir>/bin/rtiobservability -ito create and run the Docker containers with the new port configuration.
9.1.2. Check that You Have the Correct File Permissions
Run docker logs <container-name> to generate the logs for the failed container,
then look for a file permissions error. An example of a file
permissions problem is shown below.
ts=2023-03-14T22:21:47.666Z caller=main.go:450 level=error msg="Error loading config (--config.file=/etc/prometheus/prometheus.yml)" file=/etc/prometheus/prometheus.yml err="open /etc/prometheus/prometheus.yml: permission denied"
Docker containers for Observability Framework require the other permission
to be “read/access” for directories, “read” for files. To resolve a file
permission problem, ensure Linux permissions of at least:
755 (rwxr-xr-x) for directories
444 (r–r–r–) for files
9.2. No Data in Dashboards
Before proceeding, make sure all Docker containers for Observability Framework are running properly (see Docker Container[s] Failed to Start) and that you have started your applications with Monitoring Library 2.0 enabled (see Monitoring Library 2.0).
9.2.1. Check that Collector Service has Discovered Your Applications
Run one or more applications configured with Monitoring Library 2.0.
Open a browser to
<servername>:<port>/metrics, whereservernameis the server where Observability Collector Service is installed andportis the port number for the Observability Collector Service Prometheus Client port (19090 is the default).Verify that you have data for the
dds_participant_presencemetric for your application(s) as highlighted below.
 # HELP exposer_transferred_bytes_total Transferred bytes to metrics services
 # TYPE exposer_transferred_bytes_total counter
 exposer_transferred_bytes_total 65289
 # HELP exposer_scrapes_total Number of times metrics were scraped
 # TYPE exposer_scrapes_total counter
 exposer_scrapes_total 60
 # HELP exposer_request_latencies Latencies of serving scrape requests, in microseconds
 # TYPE exposer_request_latencies summary
 exposer_request_latencies_count 60
 exposer_request_latencies_sum 25681
 exposer_request_latencies{quantile="0.5"} 316
 exposer_request_latencies{quantile="0.9"} 522
 exposer_request_latencies{quantile="0.99"} 728
 # TYPE dds_participant_presence gauge
 dds_participant_presence{guid="AC462E9B.9BB5237C.DBB61B21.80B55CD8",owner_guid="F8824B73.10EBC319.4ACD1E47.9ECB3033",dds_guid="010130C4.C84EFC6D.973810C6.000001C1",domain_id="57",platform="x64Linux4gcc7.3.0",product_version="<version>",name="/applications/SensorSubscriber/domain_participants/Temperature DomainParticipant",hostname="presanella",process_id="458392"} 1 1678836129957
 dds_participant_presence{guid="291C3B07.34755D99.608E7BF3.1F6546D9",owner_guid="566D1E8D.5D7CBFD4.DD65CC20.C33D56E9",dds_guid="0101416F.425D03B2.8AC75FC8.000001C1",domain_id="57",platform="x64Linux4gcc7.3.0",product_version="<version>",name="/applications/SensorPublisher_2/domain_participants/Temperature DomainParticipant",hostname="presanella",process_id="458369"} 1 1678836129957
 dds_participant_presence{guid="1D5929EC.4FB3CAE4.300F0DB0.C553A54F",owner_guid="D2FD6E87.D8C03AAA.EABFB1F8.E941495B",dds_guid="0101FBDA.551F142B.619EE527.000001C1",domain_id="57",platform="x64Linux4gcc7.3.0",product_version="<version>",name="/applications/SensorPublisher_1/domain_participants/Temperature DomainParticipant",hostname="presanella",process_id="458346"} 1 1678836129957
If there is no metric data available, you will see data as shown below with metric documentation only, but no metric data.
# HELP exposer_transferred_bytes_total Transferred bytes to metrics services
# TYPE exposer_transferred_bytes_total counter
exposer_transferred_bytes_total 4017
# HELP exposer_scrapes_total Number of times metrics were scraped
# TYPE exposer_scrapes_total counter
exposer_scrapes_total 4
# HELP exposer_request_latencies Latencies of serving scrape requests, in microseconds
# TYPE exposer_request_latencies summary
exposer_request_latencies_count 4
exposer_request_latencies_sum 2510
exposer_request_latencies{quantile="0.5"} 564
exposer_request_latencies{quantile="0.9"} 621
exposer_request_latencies{quantile="0.99"} 621
# TYPE dds_participant_presence gauge
# TYPE dds_participant_udpv4_usage_in_net_pkts_period_ms gauge
# TYPE dds_participant_udpv4_usage_in_net_pkts_count gauge
# TYPE dds_participant_udpv4_usage_in_net_pkts_mean gauge
# TYPE dds_participant_udpv4_usage_in_net_pkts_min gauge
# TYPE dds_participant_udpv4_usage_in_net_pkts_max gauge
# TYPE dds_participant_udpv4_usage_in_net_bytes_period_ms gauge
# TYPE dds_participant_udpv4_usage_in_net_bytes_count gauge
# TYPE dds_participant_udpv4_usage_in_net_bytes_mean gauge
# TYPE dds_participant_udpv4_usage_in_net_bytes_min gauge
# TYPE dds_participant_udpv4_usage_in_net_bytes_max gauge
# TYPE dds_participant_udpv4_usage_out_net_pkts_period_ms gauge
# TYPE dds_participant_udpv4_usage_out_net_pkts_count gauge
# TYPE dds_participant_udpv4_usage_out_net_pkts_mean gauge
# TYPE dds_participant_udpv4_usage_out_net_pkts_min gauge
# TYPE dds_participant_udpv4_usage_out_net_pkts_max gauge
# TYPE dds_participant_udpv4_usage_out_net_bytes_period_ms gauge
# TYPE dds_participant_udpv4_usage_out_net_bytes_count gauge
# TYPE dds_participant_udpv4_usage_out_net_bytes_mean gauge
# TYPE dds_participant_udpv4_usage_out_net_bytes_min gauge
# TYPE dds_participant_udpv4_usage_out_net_bytes_max gauge
# TYPE dds_participant_udpv6_usage_in_net_pkts_period_ms gauge
# TYPE dds_participant_udpv6_usage_in_net_pkts_count gauge
# TYPE dds_participant_udpv6_usage_in_net_pkts_mean gauge
# TYPE dds_participant_udpv6_usage_in_net_pkts_min gauge
# TYPE dds_participant_udpv6_usage_in_net_pkts_max gauge
# TYPE dds_participant_udpv6_usage_in_net_bytes_period_ms gauge
# TYPE dds_participant_udpv6_usage_in_net_bytes_count gauge
# TYPE dds_participant_udpv6_usage_in_net_bytes_mean gauge
# TYPE dds_participant_udpv6_usage_in_net_bytes_min gauge
# TYPE dds_participant_udpv6_usage_in_net_bytes_max gauge
# TYPE dds_participant_udpv6_usage_out_net_pkts_period_ms gauge
# TYPE dds_participant_udpv6_usage_out_net_pkts_count gauge
# TYPE dds_participant_udpv6_usage_out_net_pkts_mean gauge
# TYPE dds_participant_udpv6_usage_out_net_pkts_min gauge
# TYPE dds_participant_udpv6_usage_out_net_pkts_max gauge
# TYPE dds_participant_udpv6_usage_out_net_bytes_period_ms gauge
# TYPE dds_participant_udpv6_usage_out_net_bytes_count gauge
# TYPE dds_participant_udpv6_usage_out_net_bytes_mean gauge
# TYPE dds_participant_udpv6_usage_out_net_bytes_min gauge
# TYPE dds_participant_udpv6_usage_out_net_bytes_max gauge
If you see metric documentation lines only, verify that your applications are configured to use the same Observability domain as Observability Collector Service (2 is the default).
If your applications are run on a machine other than the one hosting Observability Collector Service, ensure that the initial peers list is configured with the IP address where Observability Collector Service is running.
For more information on configuring Monitoring Library 2.0 for your application, see Monitoring Library 2.0.
9.2.2. Check that Prometheus can Access Collector Service
Open a browser to <servername>:<port> where servername is the server
where Prometheus is installed and port is the port number for the Prometheus
Server (9090 is the default).
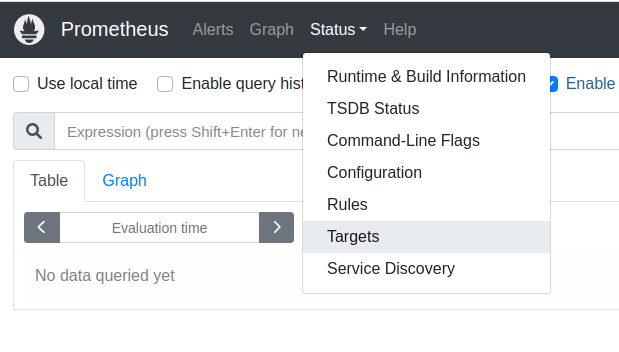
Select the Status > Targets menu to view configured targets as shown below.
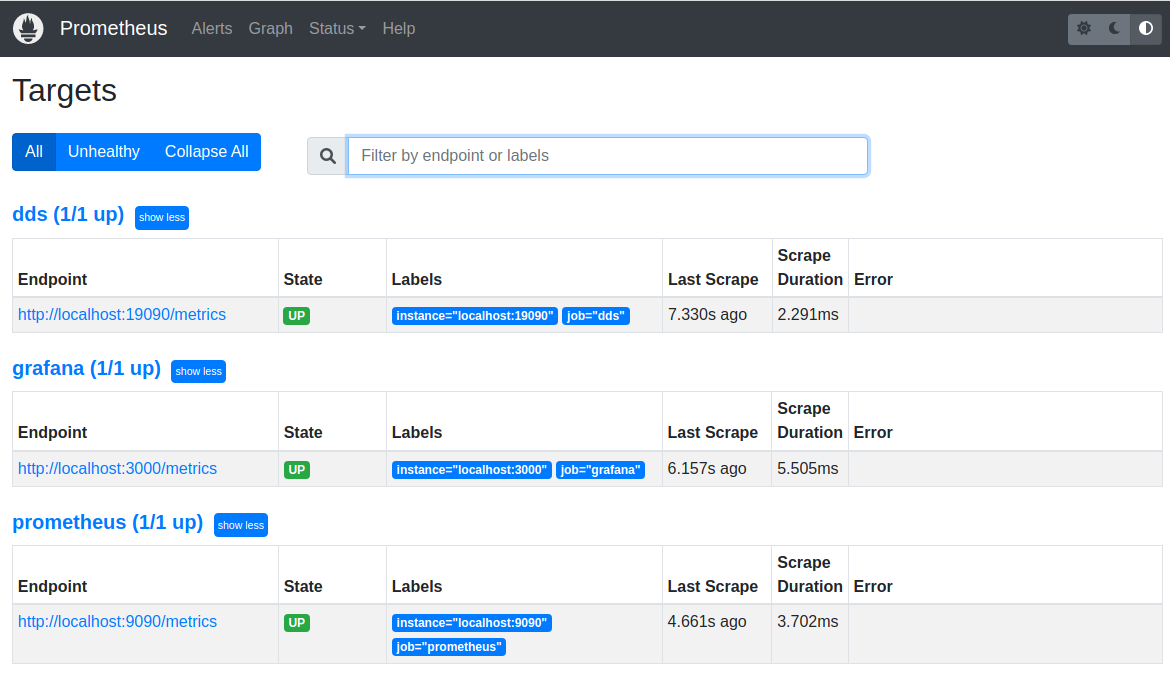
A Prometheus Server with all healthy targets is shown below.
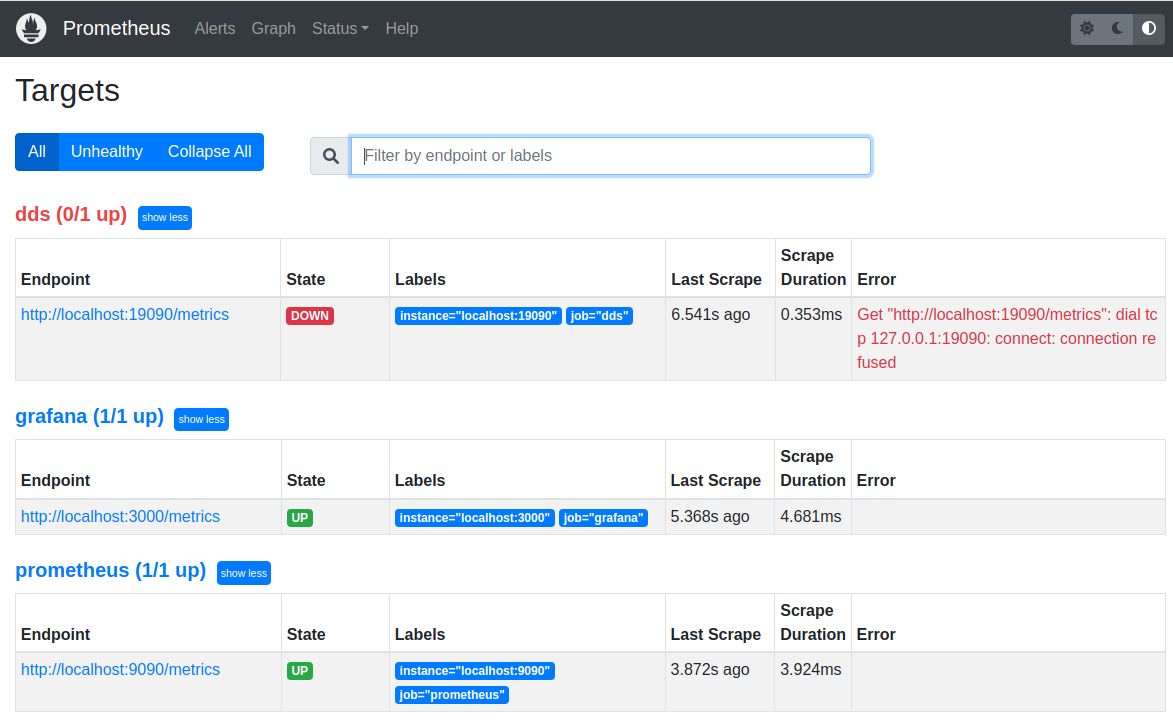
A Prometheus Server with an unhealthy Collector Service is shown below. Note
the DOWN indication for the state of the dds target.
If Collector Service is shown as DOWN, check the following:
Collector Service is running.
The
EndpointURL for Collector Service is correct (including port).Examine the
Errorto see if there is another cause being reported.
9.2.3. Check that Grafana can Access Prometheus
Note
These steps can only be performed as a Grafana Admin user.
Note
The Grafana images in this section were generated with Grafana version 9.2.1. If you are using a different version of Grafana, the details might be slightly different.
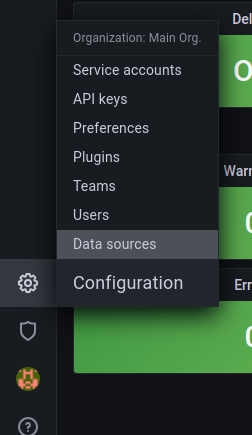
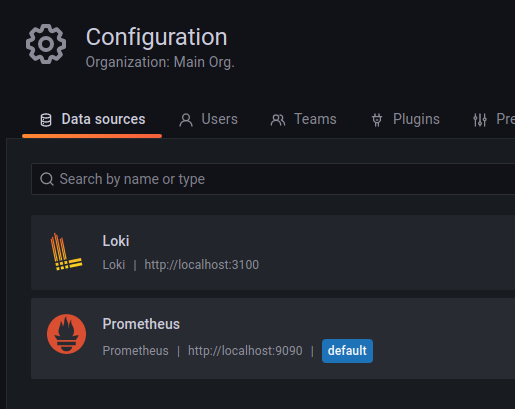
Open the Grafana Data Sources Configuration page.
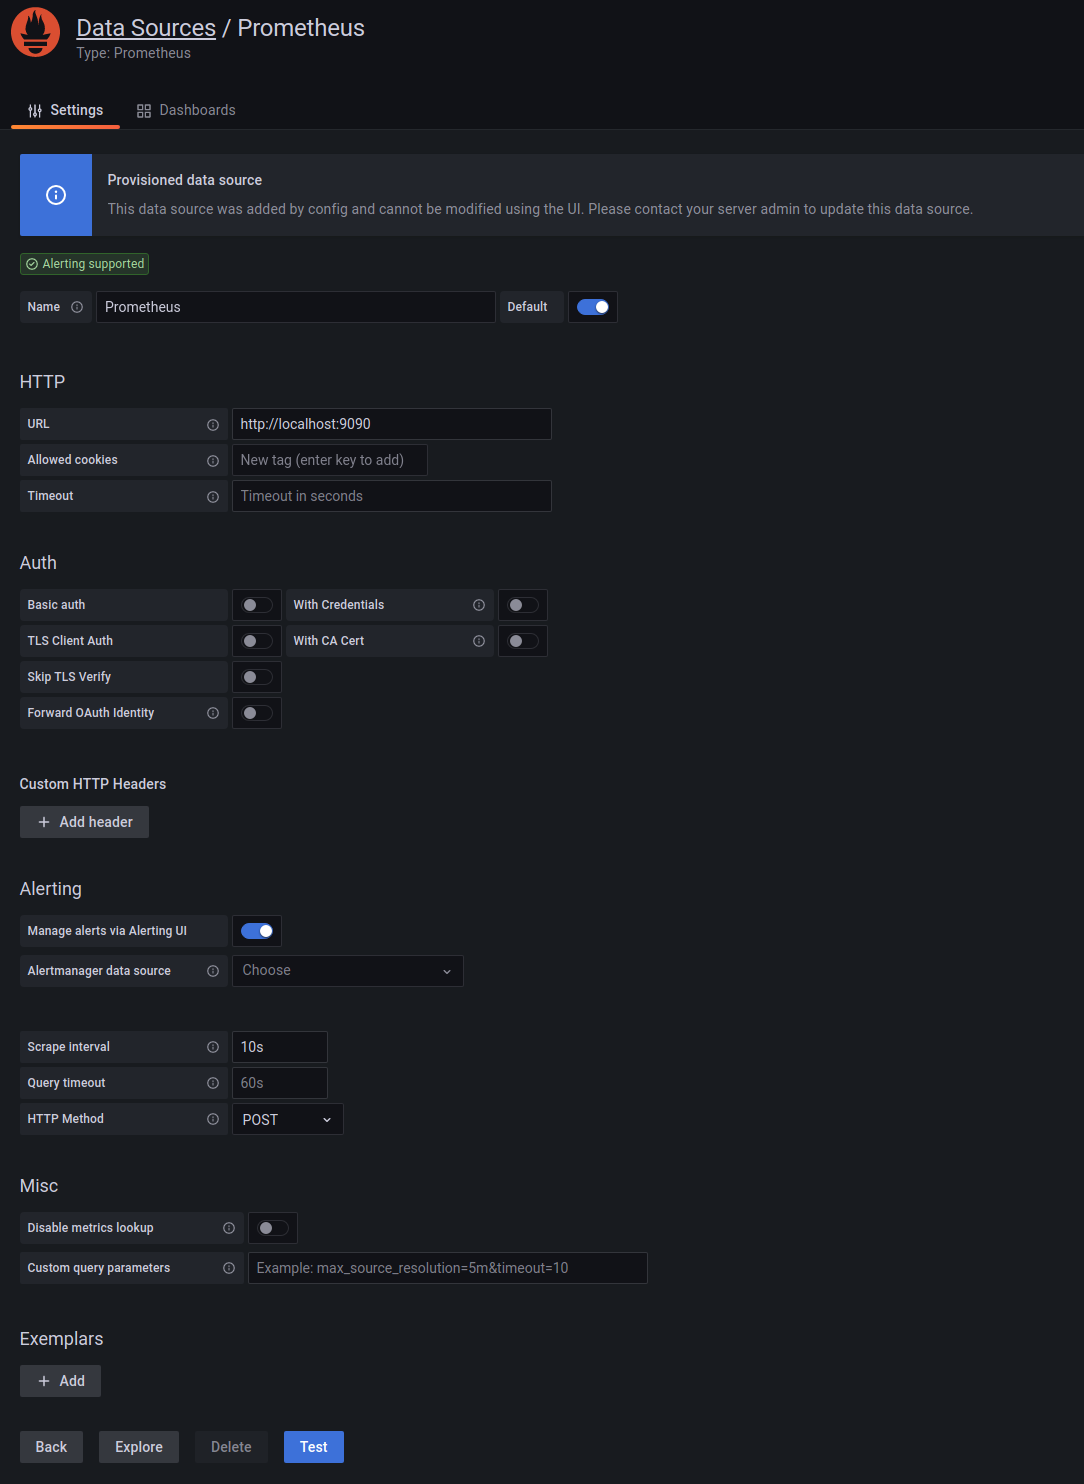
Select the “Prometheus” data source.
Scroll down and click Test to ensure that Grafana has connectivity with the Prometheus server.
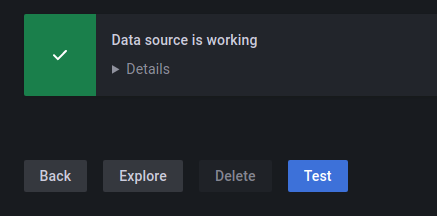
A Prometheus Data Source connectivity test that passes is shown below.
A Prometheus Data Source connectivity test that fails is shown below.
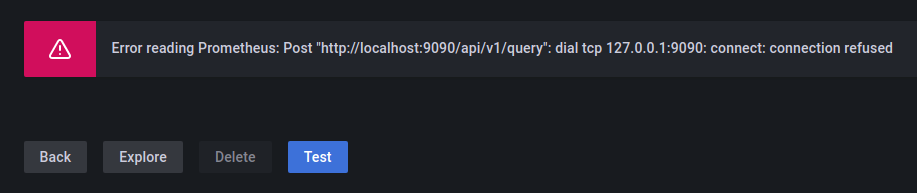
If the Prometheus Data Source connectivity test fails, check the following:
The Prometheus Server is running.
The HTTP URL matches your Prometheus server URL (including port).
Examine the error response to debug the connection.