10. Observability Dashboards
Observability Dashboards enable you to visualize the telemetry data collected from Connext applications. Using a set of customized Grafana dashboards, this Observability Framework component provides a visual reference for the logs and metrics configured for collection in Monitoring Library 2.0.
This section describes the custom Grafana dashboards provided in Observability Dashboards. All of these dashboards are based on the current time period selected, the last hour by default.
10.1. System Status Dashboards
System Status dashboards group alerts by category to provide an overview of your system’s health. These dashboards share common display elements and show related status information.
Dashboard Name |
Description |
|---|---|
Alert Home |
Displays the overall system health. This dashboard displays the high-level status of the aggregated error metrics that make up the alert categories Bandwidth, Saturation, Data Loss, System Errors, and Delays, as well as the state of system logs. |
Alert Bandwidth |
Displays the state of the raw error metrics related to Bandwidth. |
Alert Saturation |
Displays the state of the raw error metrics related to Saturation. |
Alert Data Loss |
Displays the state of the raw error metrics related to Data Loss. |
Alert System Errors |
Displays the state of the raw error metrics related to detected DDS System Errors. |
Alert Delays |
Displays the state of the raw error metrics related to Delays in data delivery. |
10.1.1. System Status Dashboard Common Elements
All System Status dashboards have two common display elements:
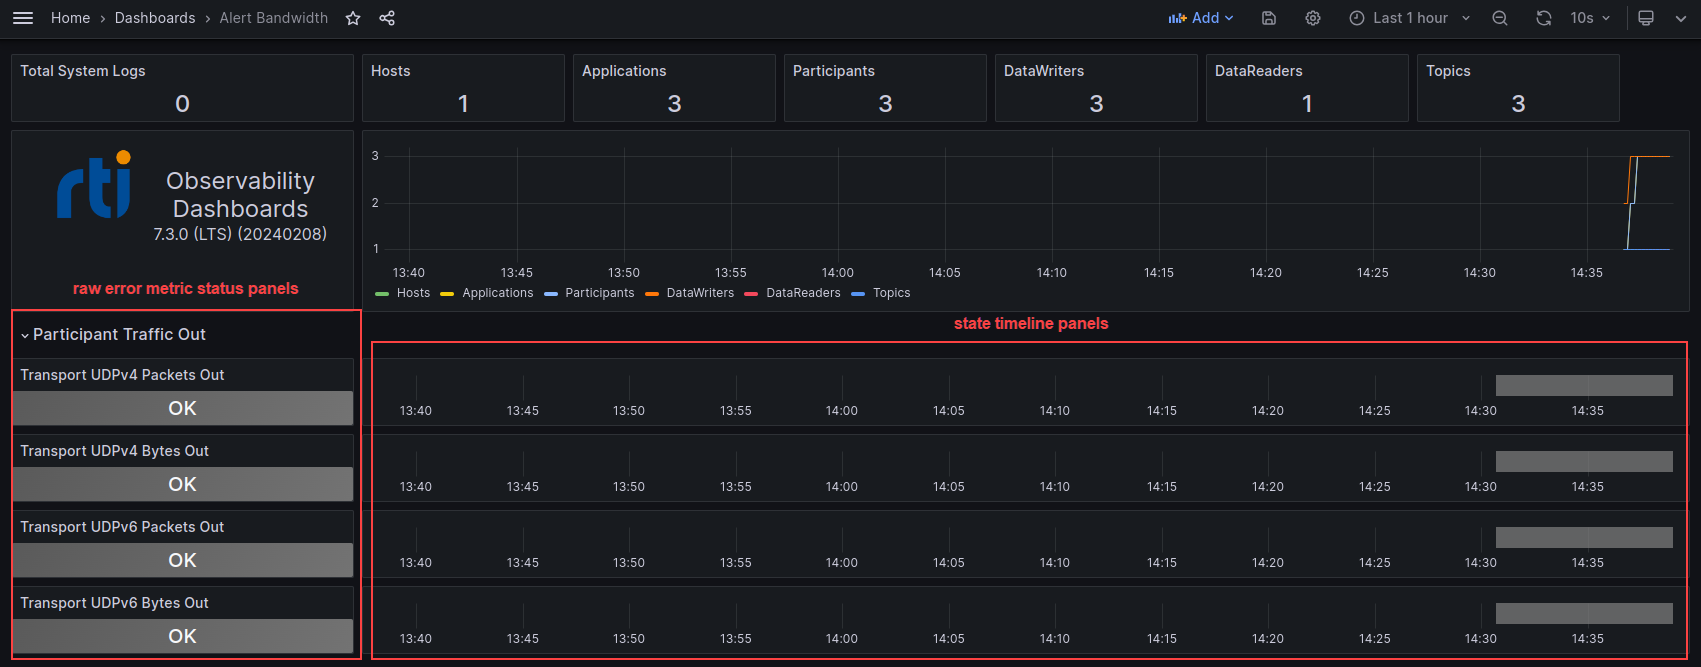
Status bar. At the top of each System Status dashboard, a set of panels displays the number of DDS system logs received and the number of hosts, Connext applications, DomainParticipants, DataReaders, DataWriters, and Topics reported to currently exist in the system. The number in each panel indicates the number of entities known to exist at the end of the current selected time period. Each panel is a button that allows you to easily navigate to a dashboard that lists all the related entities found in the system. For example, to see a list of all existing DataWriters, click the DataWriters panel.

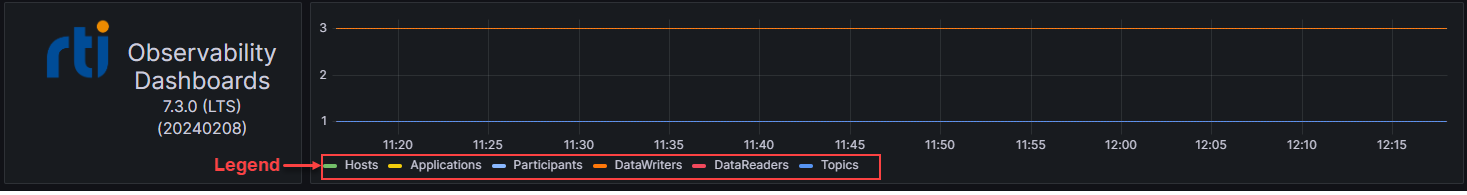
Time series chart. Under the status bar, a line chart displays the history of each active DDS entity, or observable resource. Each resource is represented by a line in the chart showing the history of the creation and destruction of each observable resource. You can select/deselect resources in the legend to view a subset of the resources on the chart.
10.1.2. Alert Home Dashboard
The Alert Home dashboard is the home dashboard for visualizing system status. This dashboard shows the current status of each alert category and the system logs. For more information on the alert categories, see Aggregated Error Metrics.
Select the Home command at the top left to return to the Alert Home dashboard from any other dashboard.
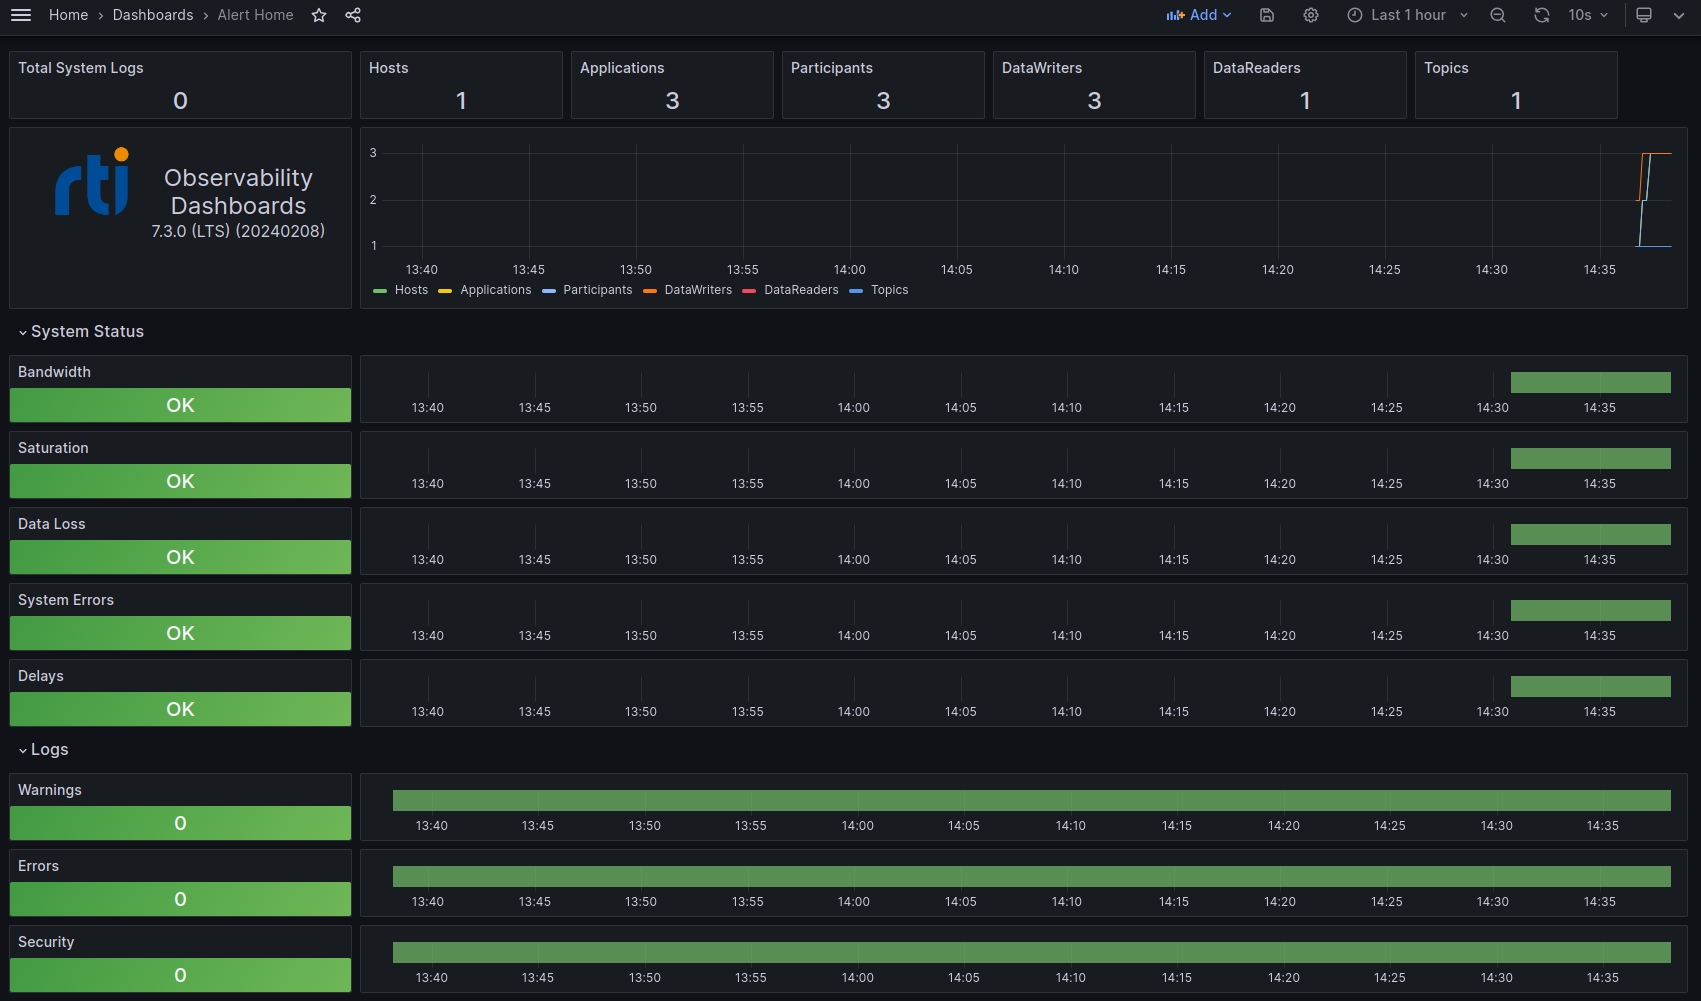
In addition to the common display elements noted in System Status Dashboard Common Elements, the Alert Home dashboard includes:
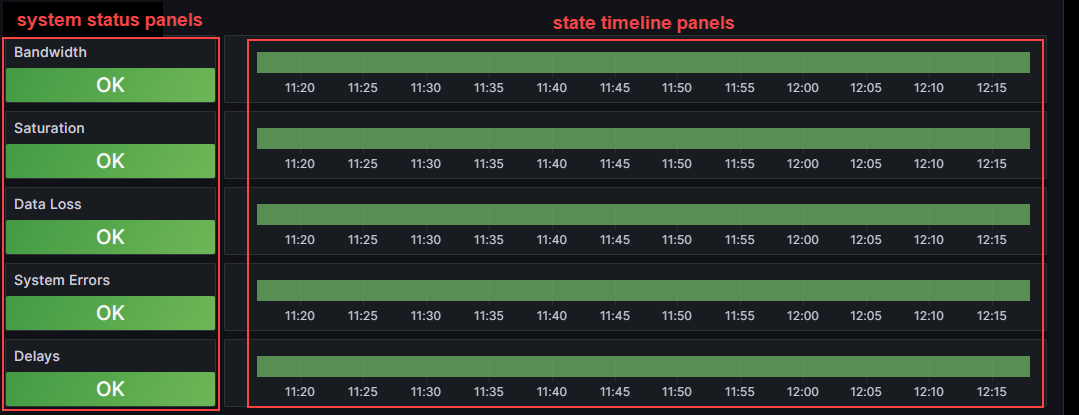
A row for each alert category that displays the current and historical state for the selected time period. Each System Status row is made up of two panels:
A status panel on the left indicates the state (OK or Error) of the alert category. The panels represent a roll up of all errors that occurred over the selected time period. If a failure condition occurred during the time period, a red Error displays in the status panel. If no failures occurred, the panel is green and displays OK. For more detail about a category, select the appropriate status panel to open a dashboard for the selected category.
A state timeline panel that shows the historical state of the alert category. The state timeline spans the time period selected and indicates any failure conditions on the timeline in red; otherwise the timeline is green. The timeline is aligned with the time series line chart near the top of the dashboard. This alignment makes it easier to detect a correlation between the creation and destruction of observable resources and possible error conditions.
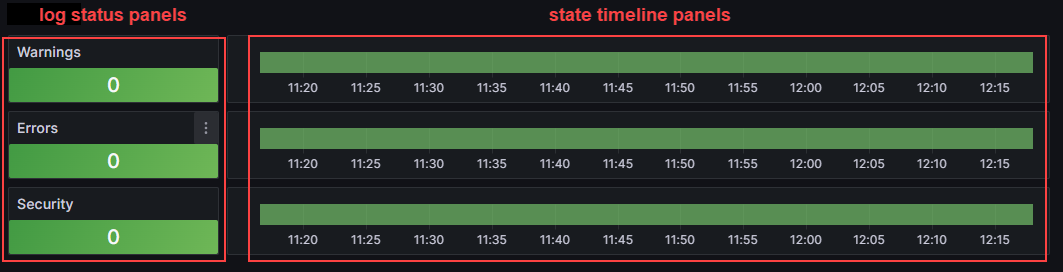
A row for each log message type that displays the current and historical state for the selected time period. Each System Status row is made up of two panels:
A status panel on the left indicates the current number of logs of the for each log type. The panels represent a roll up of the number of logs that occurred over the selected time period. If logs occurred during the time period, the number of logs displays in red; otherwise, the panel is green. For more details about a log type, select the appropriate status panel to open a dashboard for the selected log type.
A state timeline panel that shows the historical state of the log type. The state timeline spans the time period selected and indicates any log occurrences on the timeline in red; otherwise the timeline is green. The timeline is aligned with the time series chart for observable resources near the top of the dashboard. This alignment makes it easier to detect a correlation between the creation and destruction of observable resources and possible logs.
10.1.3. Alert Category Dashboards
Alert Category dashboards provide detailed status information and all associated raw error metrics for a single alert category. These dashboards show the current state of each of the raw error metrics associated with an alert category. For more information, see Aggregated Error Metrics and Raw Error Metrics.
To access, select the associated alert category status panel on the Alert Home dashboard. For example, to open the Alert Bandwidth dashboard, click the Bandwidth status panel.
In addition to the common display elements noted in System Status Dashboard Common Elements, the Alert Category dashboards include a row for each of the raw error metrics that make up the selected alert category. The rows are logically grouped by the associated Connext entities (application, DomainParticipant, DataReader, DataWriter, and Topic). Each row is made up of two panels:
A status panel on the left indicates the state (OK or Error) of the raw error metric. The panels represent a roll up of all errors that occurred over the selected time period. If a failure condition occurred, a red Error displays in the status panel. If no failures occurred, the panel is green and displays OK. For more details about a raw error metric, select the appropriate status panel to open an Entity List dashboard that lists all resources containing the raw error metric.
A state timeline panel that shows the historical state of the raw error metric. The state timeline spans the time period selected and indicates any failure conditions on the timeline in red; otherwise, the timeline is green. The timeline is aligned with the time series line chart near the top of the dashboard. This alignment makes it easier to detect a correlation between the creation and destruction of observable resources and possible error conditions.
10.2. Entity List Dashboards
Entity List dashboards provide a list of the current observable resources that match the selected entity type.
Dashboard Name |
Description |
|---|---|
Host List |
Displays the list of unique Hosts (by name) found in the system |
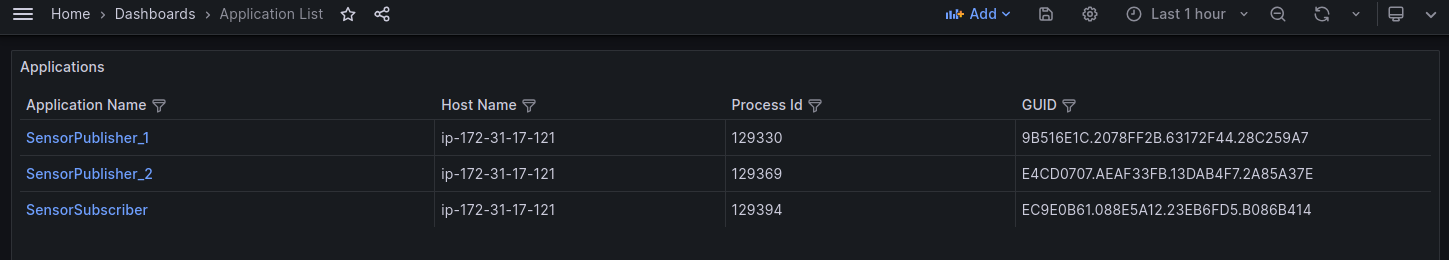
Application List |
Displays the list of Connext applications found in the system |
Participant List |
Displays the list of DomainParticipants found in the system |
DataReader List |
Displays the list of DataReaders found in the system |
DataWriter List |
Displays the list of DataWriters found in the system |
Topic List |
Displays the list of Topics found in the system |
To access an Entity List dashboard, select the desired entity count panel on the status bar at the top of any System Status or Log dashboard.
All Entity List dashboards have the following common display elements:
A single table panel that lists all observable resources of the selected type. The table columns display associated metadata for each resource.
A link for each resource that opens the Entity Status dashboard for the selected resource.
10.3. Entity Status List Dashboards
Entity Status List dashboards list the observable resources that contain the selected raw error metric, and the status of that metric for each resource.
Dashboard Name |
Description |
|---|---|
Alert Application Status List |
Displays the list of Connext applications found in the system, plus the status of the associated raw error metric for the panel that sent you here. |
Alert Participant Status List |
Displays the list of DomainParticipants found in the system, plus the status of the associated raw error metric for the panel that sent you here. |
Alert DataReader Status List |
Displays the list of DataReaders found in the system, plus the status of the associated raw error metric for the panel that sent you here. |
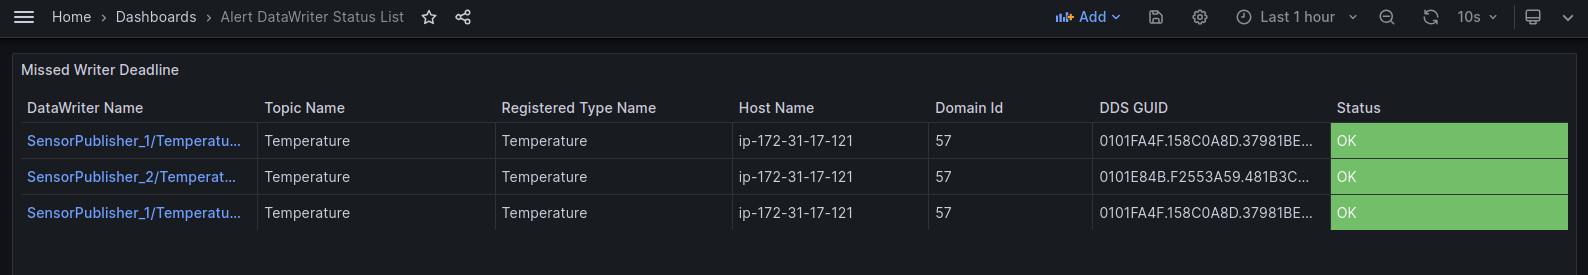
Alert DataWriter Status List |
Displays the list of DataWriters found in the system, plus the status of the associated raw error metric for the panel that sent you here. |
Alert Topic Status List |
Displays the list of Topics found in the system, plus the status of the associated raw error metric for the panel that sent you here. |
To access an Entity Status List dashboard, select a raw error metric status panel on any of the Alert Category dashboards. For example, select the Pulled Samples status panel on the Alert Bandwidth dashboard to open the Alert DataWriter Status List dashboard.
All Entity Status List dashboards have the following common display elements:
A single table panel that lists all observable resources that contain the selected raw error metric. The table columns display associated metadata for each resource. The Status column indicates the current status (OK or Error) of each raw error metric.
A link for each resource that opens the Entity Status dashboard for the selected resource.
10.4. Entity Status Dashboards
Entity Status dashboards provide telemetry metadata and historical charts for a single observable resource.
Dashboard Name |
Description |
|---|---|
Alert Application Status |
Displays the metadata for a Connext application instance and historical charts of selected raw metrics for this observable resource. |
Alert Participant Status |
Displays the metadata for a DomainParticipant instance and historical charts of selected raw metrics for this observable resource. |
Alert DataReader Status |
Displays the metadata for a DataReader instance and historical charts of selected raw metrics for this observable resource. |
Alert DataWriter Status |
Displays the metadata for a DataWriter instance and historical charts of selected raw metrics for this observable resource. |
Alert Topic Status |
Displays the metadata for a Topic instance and historical charts of selected raw metrics for this observable resource. |
To access an Entity Status dashboard, select any of the following:
A resource link in an Entity Status dashboard. For example, select a DataReader Name link on the Alert DataReader Status List dashboard.
A resource link in an Entity List dashboard. For example, select a DataWriter Name link on the DataWriter List dashboard.
A resource link in the resource name of an Entity List dashboard. For example, select the DomainParticipant on an Alert DataWriter Status dashboard.
A log message link in the Log Dashboard (will access the associated Alert Application Status dashboard).
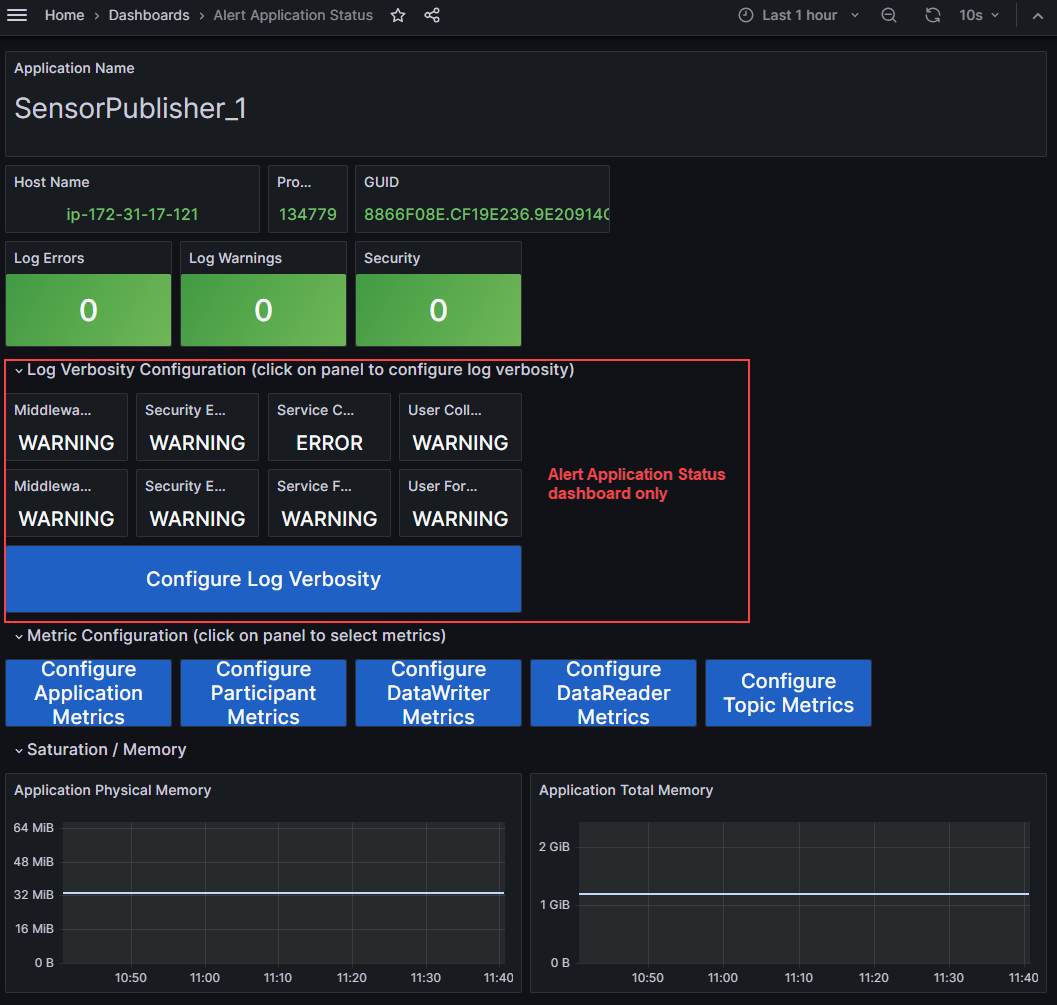
All Entity Status dashboards have the following common display elements:
A panel indicating the resource name.
A group of panels displaying metadata associated with the resource.
Panels providing the number of logs associated with the resource. These panels are buttons that allow you to navigate to the Entity Log dashboard for the current resource.
One or more metric configuration panels that allow you to navigate to the relevant Metric Control dashboards.
[Alert Application Status only] Panels that display the current log collection and forwarding verbosity for each log category. See Logs for more information on logs.
[Alert Application Status only] A panel that allows you to navigate to the Log Control dashboard.
10.5. Log Dashboards
Log dashboards list the logs generated by the system.
Dashboard Name |
Description |
|---|---|
Log Dashboard |
Displays all logs in the system and provides filtering by log level, facility, category, application, and ad hoc text. |
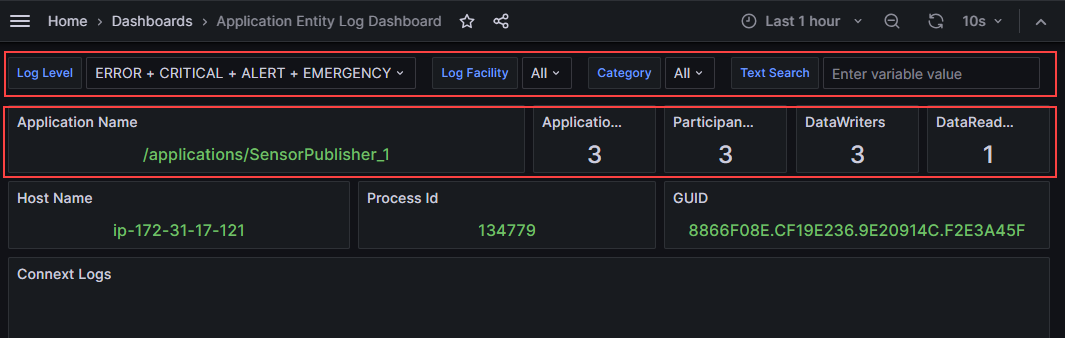
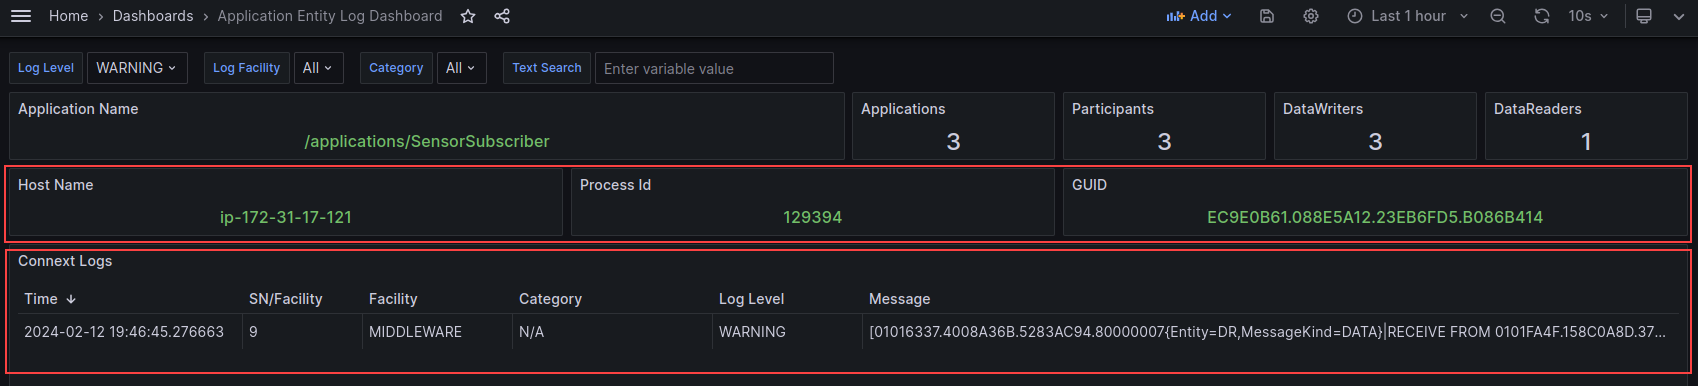
Application Entity Log Dashboard |
Displays logs for a Connext application instance and provides filtering by log level, facility, category, and ad hoc text. |
Participant Entity Log Dashboard |
Displays logs for a DomainParticipant instance and provides filtering by log level, facility, category, and ad hoc text. |
DataReader Entity Log Dashboard |
Displays logs for a DataReader instance and provides filtering by log level, facility, category, and ad hoc text. |
DataWriter Entity Log Dashboard |
Displays logs for a DataWriter instance and provides filtering by log level, facility, category, and ad hoc text. |
All Log dashboards have the following common display elements:
A set of dropdown menus that enable you to select one or more filter criteria. The available filters include Log Level, Log Facility, Category, Application, and Text Search.
A set of entity count panels that provide the current number of Connext applications, DomainParticipants, DataReaders, and DataWriters. Each panel displays the number of active entities at the end of the selected time period. Click any entity count panel to open an Entity List dashboard.
10.5.1. Log Dashboard
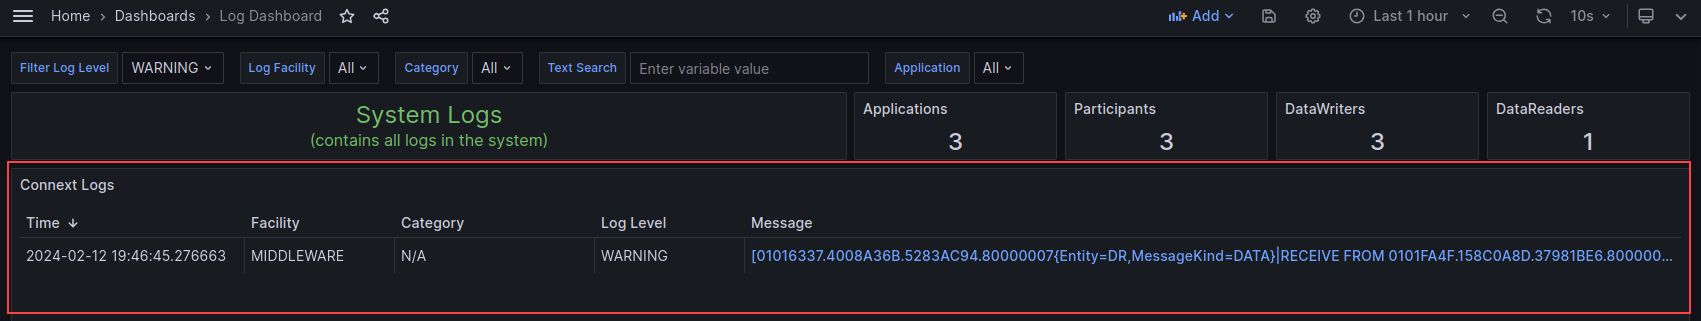
The Log Dashboard displays all of the log messages generated by the system.
To access the Log dashboard, select any of the log status panels (Total System Logs, Warnings, Errors, or Security) on the Alert Home dashboard. Log dashboard data is filtered based on how you accessed it. For example, select the Warnings status panel on the Alert Home dashboard to open the Log dashboard with the WARNING log level filter in place.
The Log Dashboard has the following display elements:
A panel that displays the list of logs in the system that pass the current filter criteria.
For each log line, several columns of associated data including Time, Facility, Category, Log Level, Plug In Class (for Security logs), and the Message. The message column is a link that navigates to the Alert Application Status dashboard for the Connext application that generated the message.
10.5.2. Entity Log Dashboards
Entity Log dashboards display all log messages generated by the system for a specific resource. To access an Entity Log Dashboard select any of the log panels on an Entity Status dashboard.
All Entity Log dashboards have the following common display elements:
A group of panels displaying metadata associated with the resource.
A panel that lists all logs in the system that pass the current filter criteria. Each log line has several columns of associated data including Time, Facility, Category, Log Level, Plug In Class (for Security logs), and the Message.
10.6. Control Dashboards
Control dashboards enable you to dynamically configure the amount of telemetry data collected and forwarded.
10.6.1. Log Control Dashboard
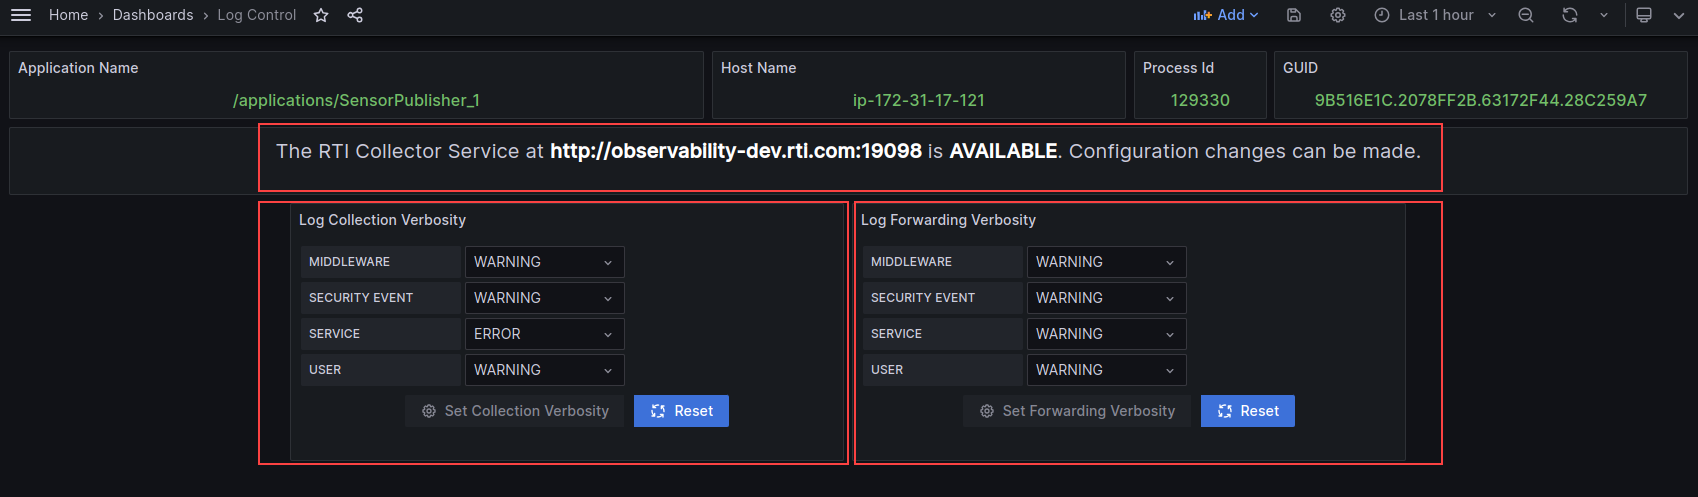
The Log Control dashboard enables you to dynamically configure the log collection and forwarding verbosity for a single Connext application instance. Configuring the verbosity levels of an application affects the number of logs generated and/or forwarded by that application.
To access the Log Control dashboard, select the Configure Log Verbosity panel on any Alert Application Status dashboard.
The Log Control dashboard has the following display elements:
A status bar indicating the URL of the Observability Collector Service Control Server and the status (AVAILABLE/NOT AVAILABLE).
AVAILABLE. The dashboard is connected to the Observability Collector Service Control Server and can send metric configuration commands.
NOT AVAILABLE. The dashboard is NOT connected to the Observability Collector Service Control Server.
A panel that allows you to change the log collection verbosity for each category. The collection verbosity affects the logs that the application generates and passes to the Monitoring Library 2.0.
A panel that allows you to change the log forwarding verbosity for each category. The forwarding verbosity controls what logs are forwarded by the Monitoring Library 2.0 to the Observability Collector Service (and subsequently stored in a backend and viewable in a dashboard).
10.6.2. Metric Control Dashboards
Metric Control dashboards enable you to configure the collection and forwarding of metric data.
10.6.2.1. Single Entity Metric Control Dashboards
Single Metric Control dashboards enable you to configure the collection and forwarding of metric data for a single observable resource. See Change the Metric Configuration for a usage example.
Dashboard Name |
Description |
|---|---|
Application Metrics |
Enables you to dynamically change the metric collection and forwarding configuration for a single Connext application instance. |
Participant Metrics |
Enables you to dynamically change the metric collection and forwarding configuration for a single DomainParticipant instance. |
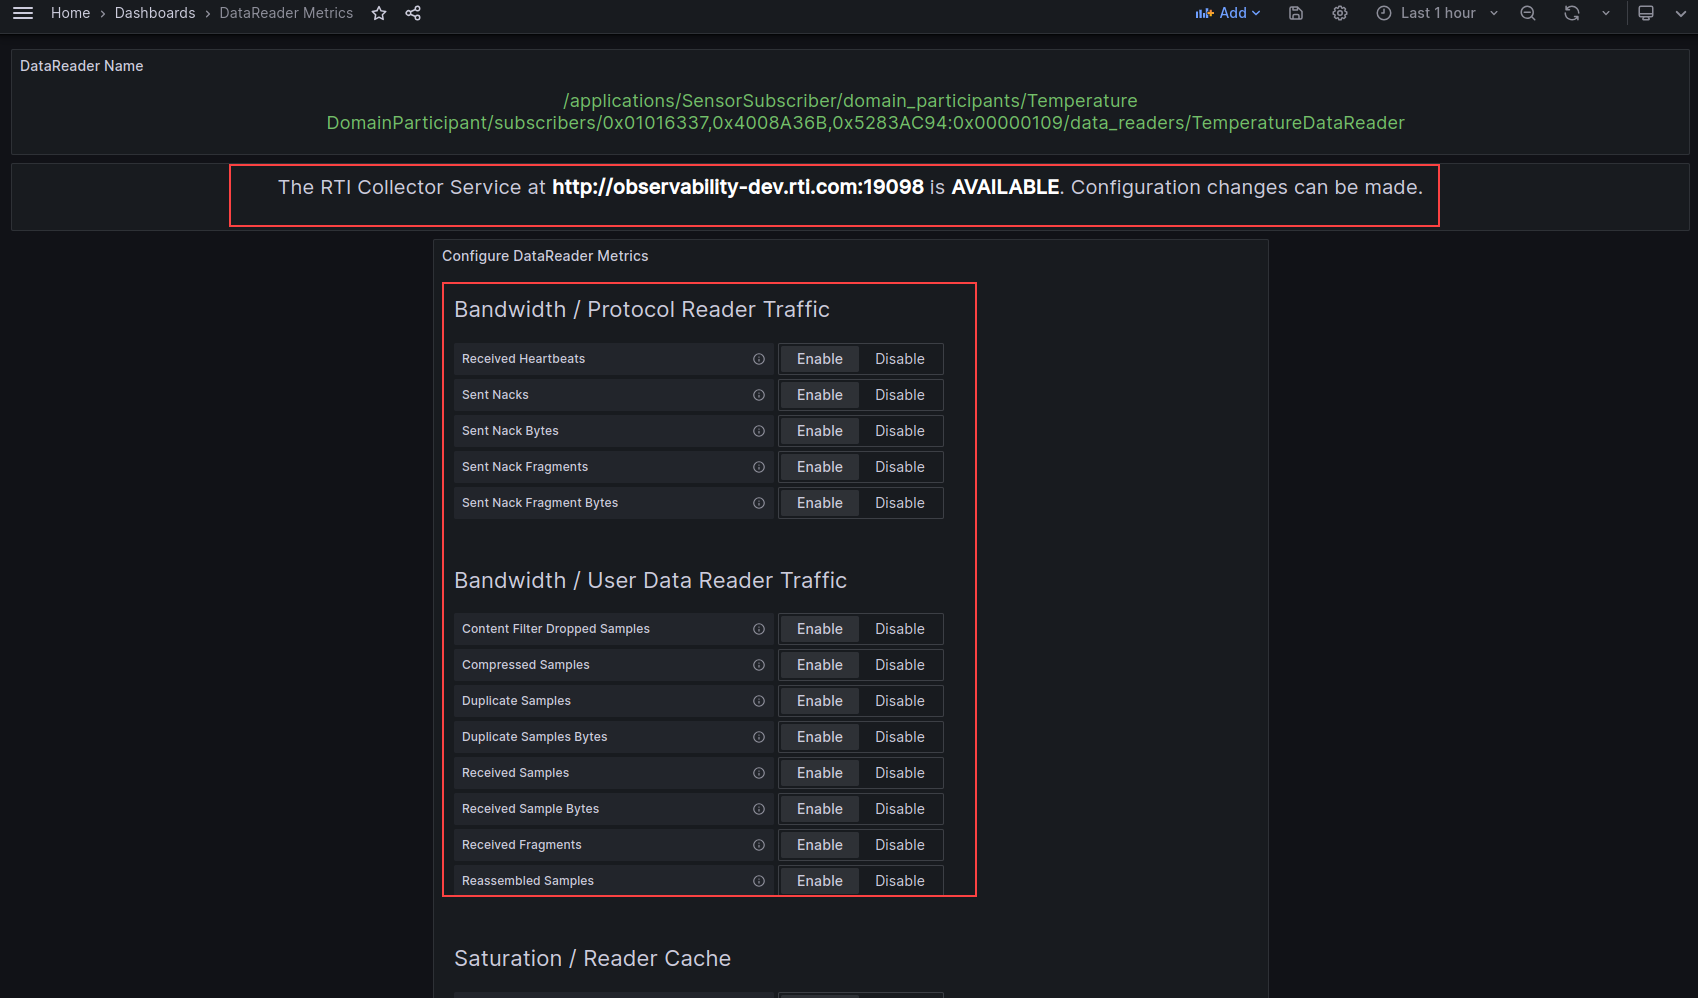
DataReader Metrics |
Enables you to dynamically change the metric collection and forwarding configuration for a single DataReader instance. |
DataWriter Metrics |
Enables you to dynamically change the metric collection and forwarding configuration for a single DataWriter instance. |
Topic Metrics |
Enables you to dynamically change the metric collection and forwarding configuration for a single Topic instance. |
To access a Single Entity Metric Control dashboard, select the Configure [Entity] Metrics panel on any Entity Status dashboard that matches the current entity type. For example, select Configure Participant Metrics on an Alert Participant Status dashboard.
All Single Entity Metric Control dashboards have the following common display elements:
A status bar indicating the URL of the Observability Collector Service Control Server and the status (AVAILABLE/NOT AVAILABLE).
AVAILABLE. The dashboard is connected to the Observability Collector Service Control Server and can send metric configuration commands.
NOT AVAILABLE. The dashboard is NOT connected to the Observability Collector Service Control Server.
A panel that shows the collection state (Enable/Disable) for each resource metric. Clicking Enable or Disable sends that command to the Observability Collector Service to enable or disable the collection state.
10.6.2.2. Multiple Entity Metric Control Dashboards
Multiple Metric Control dashboards enable you to configure the collection and forwarding of metric data for all observable resources contained by another resource (for example, all DataReaders of a DomainParticipant). See Change the Metric Configuration for a usage example.
Dashboard Name |
Description |
|---|---|
Participant Metrics Multi |
Enables you to dynamically change the metric collection and forwarding configuration for all DomainParticipant instances of a Connext application. |
DataReader Metrics Multi |
Enables you to dynamically change the metric collection and forwarding configuration for all DataReader instances of the current resource. A resource can be a Connext application or DomainParticipant. |
DataWriter Metrics Multi |
Enables you to dynamically change the metric collection and forwarding configuration for all DataWriter instances of the current resource. A resource can be a Connext application or DomainParticipant. |
Topic Metrics Multi |
Enables you to dynamically change the metric collection and forwarding configuration for all Topic instances of the current resource. A resource can be a Connext application or DomainParticipant. |
To access a Multiple Entity Metric Control dashboard, select the appropriate Configure [Entity] Metrics panel on any Entity Status dashboard that is a hierarchical parent of entities. For example, select Configure DataWriter Metrics on either an Alert Application Status dashboard or an Alert Participant Status dashboard.
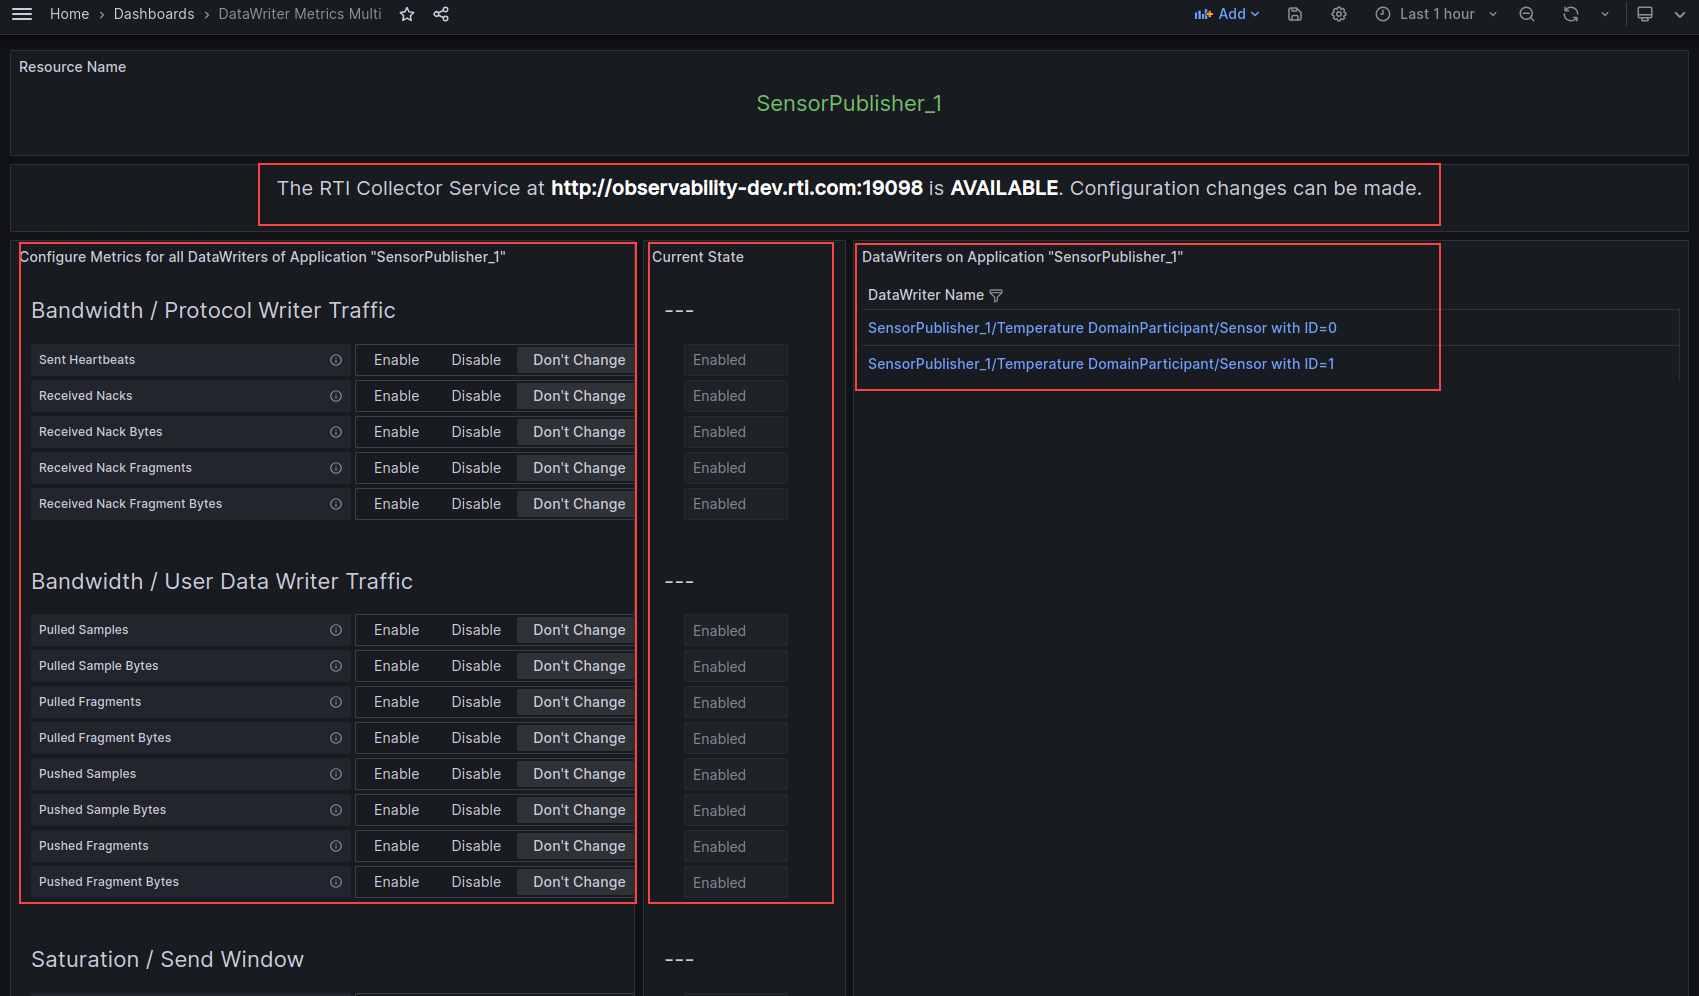
All Multiple Entity Metric Control dashboards have the following display elements:
A status bar indicating the URL of the Observability Collector Service Control Server and the status (AVAILABLE/NOT AVAILABLE).
AVAILABLE. The dashboard is connected to the Observability Collector Service Control Server and can send metric configuration commands.
NOT AVAILABLE. The dashboard is NOT connected to the Observability Collector Service Control Server.
A panel that allows you to explicitly Enable or Disable the collection and forwarding of the selected metric. This selection affects all observable resources of the current resource regardless of the current collection state.
A panel that shows the collection state (Enabled/Disabled/Partial) for each metric of the resource type.
Enabled. The metric is enabled for all resources in the container resource.
Disabled. The metric is disabled for all resources in the container resource.
Partial. Some contained resources have the metric enabled and some have it disabled.
A panel that lists all observable resources that will be affected by configuration changes. Each entry in the list links to the Single Entity Metric Control dashboard for the selected resource.