2. Components
Connext Observability Framework consists of three RTI components:
RTI Monitoring Library 2.0 enables you to instrument a Connext application to forward telemetry data. The library also accepts remote commands to change the set of forwarded telemetry data at runtime.
RTI Observability Collector Service scalably collects telemetry data from multiple Connext applications and stores this data in a third-party observability backend. This component can also be configured to forward telemetry data to an OpenTelemetry Collector to allow integration with other third-party observability backends.
RTI Observability Dashboards enable you to visualize and alert based on the Connext application metrics, as well as display Connext log messages.
Observability Framework requires third-party components for storing and visualizing telemetry data. This release provides native integration with Prometheus for metrics storage, Grafana Loki for logs storage, and Grafana for visualization. Integration with other third-party components is also possible when using OpenTelemetry and the OpenTelemetry Collector.
Observability Dashboards are provided as a set of Grafana dashboards to be deployed on a Grafana server. These dashboards only work with the Prometheus and Grafana Loki backends. Future releases could support other backends.
Figure 2.1 shows a simple representation of how Observability Framework components work together.
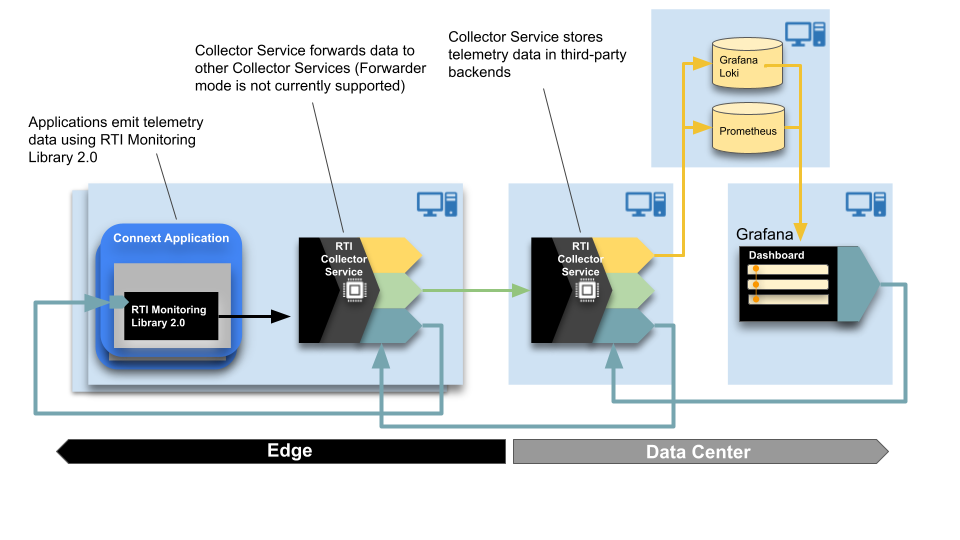
Figure 2.1 Observability Framework Components
2.1. Monitoring Library 2.0
Monitoring Library 2.0 includes the following key features:
Collection and forwarding of Connext metrics and logs (including security event logs).
Configuration using a new MONITORING QosPolicy (DDS Extension). The QoS policy can be set programmatically or via XML.
Runtime changes to the collection and forwarding of telemetry data using remote commands from Observability Collector Service.
Ability to enable and disable use of Monitoring Library 2.0 at runtime by changing the Monitoring QoS policy.
Lower overhead as compared to using the RTI Monitoring Library.
For more information, see Monitoring Library 2.0.
2.2. Observability Collector Service
Observability Collector Service scalably collects telemetry data forwarded by Monitoring Library 2.0 in a Connext application. Collector Service is distributed as a Docker™ image. For additional information on this image see Dockerhub. The Observability Collector Service is designed to work in two modes:
Storage: Collector Service sends the telemetry data for storage to third-party observability backends. This release provides native integration with Prometheus for metrics and Grafana Loki for logs. Integration with other third-party components is also possible using OpenTelemetry and the OpenTelemetry Collector.
Forwarder: Collector Service forwards the telemetry data from Connext applications to another collector instance. This mode is not supported in the current release.
Observability Collector Service includes the following key features:
Collecting and filtering telemetry data forwarded by Connext applications (using Monitoring Library 2.0) or other collectors. This release does not provide filtering capabilities.
Sending telemetry data for storage to Prometheus for metrics and Grafana Loki for logs.
Ability to send telemetry data to an OpenTelemetry Collector using the OpenTelemetry protocol (OTLP). This feature enables integration with third-party observability backends other than Prometheus and Grafana Loki.
Remote command forwarding from Observability Dashboards to the Connext applications and other resources to which the commands are directed. Remote commands may be used to control the forwarding of log messages and metrics. For detailed information on the commands supported see Collector Service REST API Reference.
2.2.1. Storage Components
Observability Collector Service includes native integration with Prometheus and Grafana Loki to store metrics and logs, respectively.
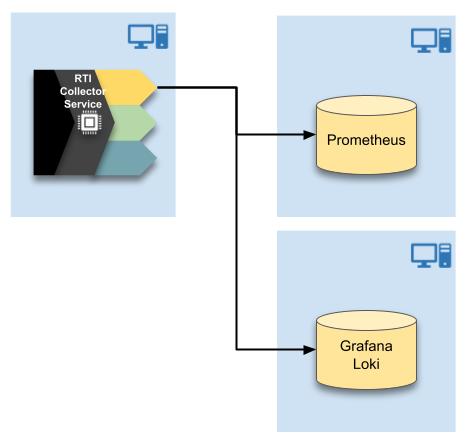
Figure 2.2 Native Integration
This release also allows integrating with other third-party storage components using OpenTelemetry and the OpenTelemetry Collector.
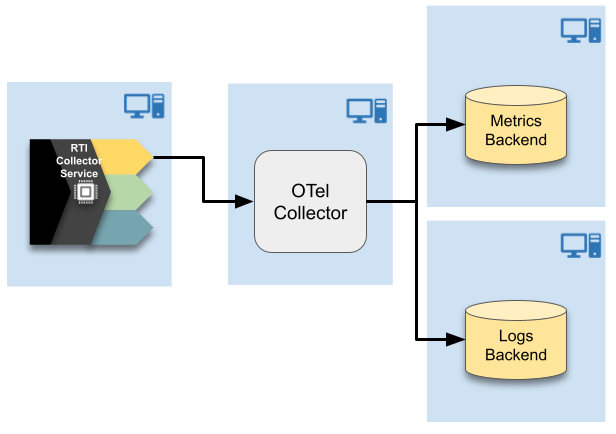
Figure 2.3 OpenTelemetry Integration
2.3. Observability Dashboards
A set of hierarchical Grafana dashboards displays alerts when a problem occurs and provides visualizations to help perform root cause analysis. The dashboards get the telemetry data from a Prometheus server and the logs from a Grafana Loki server.
See Observability Dashboards for more information on the Observability Dashboards.