3. Observability Framework Deployments
This section describes how to deploy the components of the Observability Framework in the current release. Additionally, it discusses how RTI intends to introduce new deployment methods for the Observability Framework in future releases.
Monitoring Library 2.0 is component is included with Connext Professional as a shared and static library called rtimonitoring2. For details on how to use the library, refer to Monitoring Library 2.0. For further information on the other components, please see the following sections.
3.1. Current Release
3.1.1. Docker Compose (Prepackaged)
3.1.1.1. Collection, Storage, and Visualization Components
The Observability Framework package enables you to deploy and run Observability Collector Service and third-party components Prometheus, Grafana Loki, Grafana, OpenTelemetry Collector (optional), and NGINX (optional) using Docker Compose™ in a single Linux® host. For details, see Supported Docker Compose Environments.
RTI’s prepackaged Docker Compose installation option facilitates initial product evaluation because it does not require you to deploy all these components individually.
Observability Framework can be deployed with or without using the OpenTelemetry Collector. Both deployment options can be configured to be secure or non-secure and to work on a LAN or WAN.
Figure 3.1 RTI Observability Framework without OpenTelemetry Collector shows the secure Observability Framework deployment without OpenTelemetry Collector. The deployment uses Prometheus and Grafana Loki to store metrics and logs, respectively.
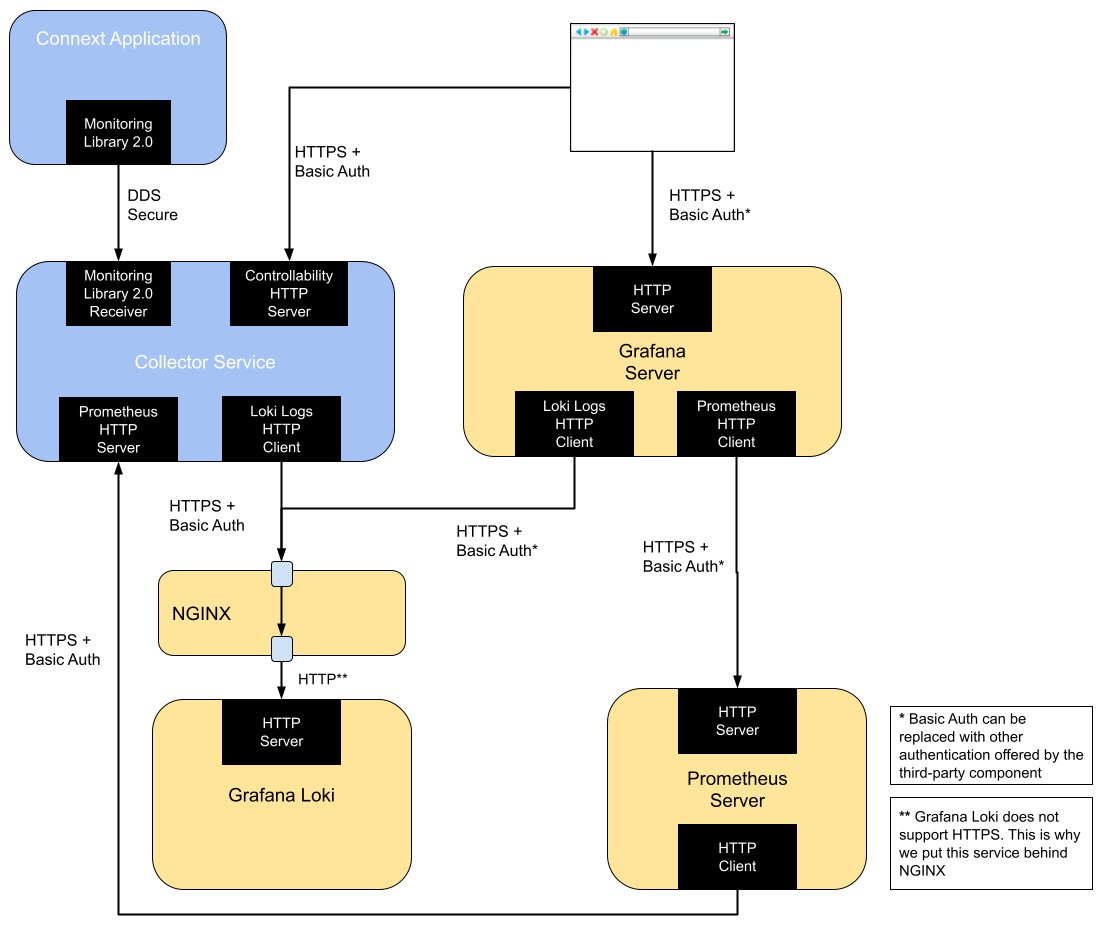
Figure 3.1 RTI Observability Framework without OpenTelemetry Collector
Figure 3.2 RTI Observability Framework with OpenTelemetry Collector shows a secure Observability Framework deployment using OpenTelemetry Collector. The deployment uses OpenTelemetry Collector to store metrics and logs in Prometheus and Grafana Loki, respectively.
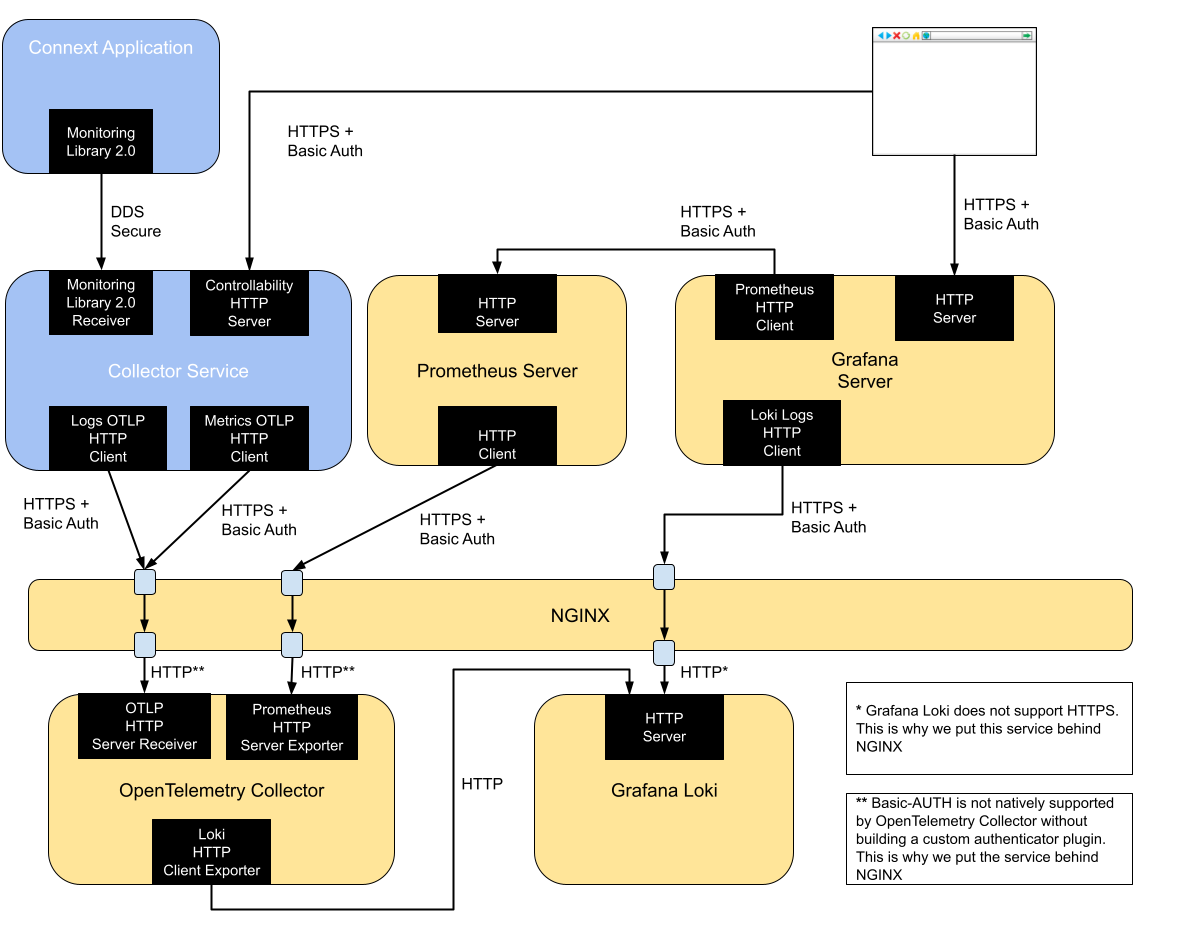
Figure 3.2 RTI Observability Framework with OpenTelemetry Collector
For additional information on how to use Docker Compose to run Observability Framework, see Configuring, Running, and Removing Observability Framework Components Using Docker Compose.
3.1.1.1.1. Collector Service
This release supports running Observability Collector Service in storage mode only. Data can be stored into Prometheus and Grafana Loki natively or into other third-party observability backends using OpenTelemetry and the OpenTelemetry Collector. The prepackaged deployment uses a single layer deployment to run only one Collector Service instance for the Connext system, as illustrated in Figure 3.3 Single Collector Deployment.
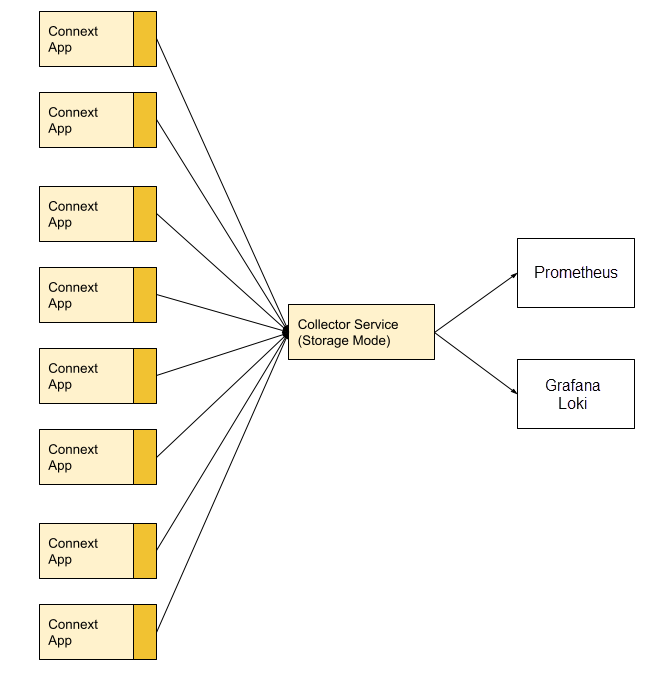
Figure 3.3 Single Collector Deployment
3.1.2. Docker (Separate Deployment)
As an alternative to the prepackaged Docker Compose deployment provided by RTI, you can also run Observability Framework and the third-party components (e.g, Prometheus) standalone.
The third-party components Prometheus, Grafana Loki, Grafana, OpenTelemetry Collector (optional), and NGINX (optional) are also distributed as Docker images by their respective vendors. You can use these images standalone instead of RTI’s prepackaged Docker Compose.
Observability Collector Service is distributed as a Docker image hosted in Dockerhub. This is the same publicly available image used by the prepackaged Docker Compose installation, and it requires a valid RTI license to run.
This release supports running Observability Collector Service in storage mode only. Data can be stored into Prometheus and Grafana Loki natively or into other third-party observability backends using OpenTelemetry and the OpenTelemetry Collector. Because forwarding mode is not supported, you can only use a single layer of Collector Services per Connext system. This configuration is illustrated in Figure 3.4 Single Layer Collector Deployment and Figure 3.5 Single Layer Collector Deployment using OpenTelemetry Collector.
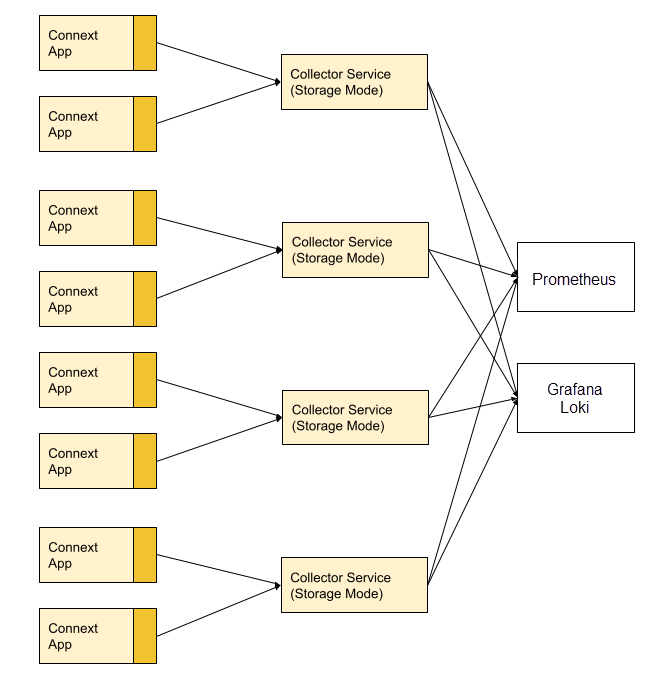
Figure 3.4 Single Layer Collector Deployment
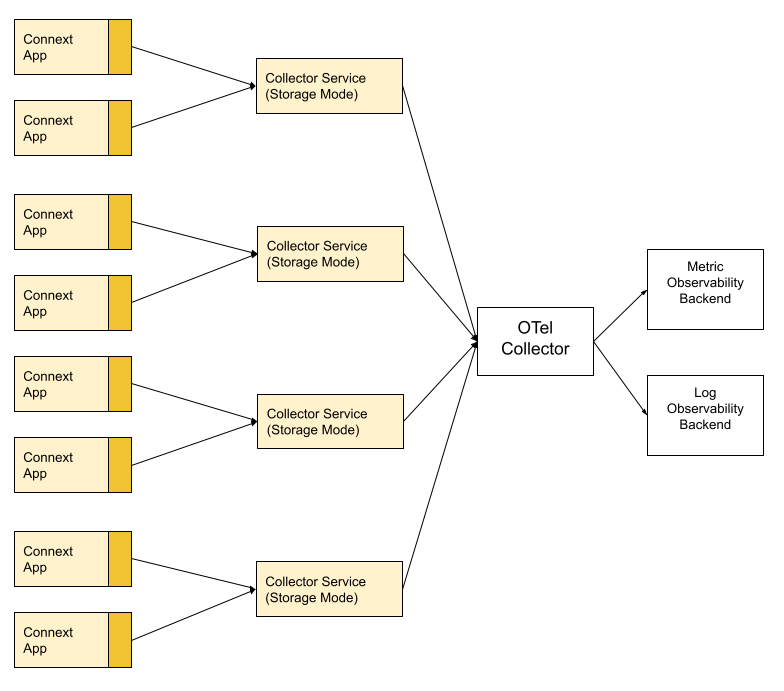
Figure 3.5 Single Layer Collector Deployment using OpenTelemetry Collector
The deployments represented in Figure 3.4 Single Layer Collector Deployment and Figure 3.5 Single Layer Collector Deployment using OpenTelemetry Collector require running multiple instances of Collector Service where each Connext application configures Monitoring Library 2.0 to connect to one of the Collector Service instances.
You are responsible for running the Collector Service instances and the third-party components for storage. For example, if you want to store telemetry data into Prometheus and Grafana Loki, you must run Prometheus and Grafana Loki instances and configure the Docker container for Collector Service to connect to these storage backends.
The Docker image included with Collector Service contains a built-in configuration that enables it to run in storage mode with the following operation modes:
Configuration Name |
Network |
Data Storage |
Security |
|---|---|---|---|
NonSecureLAN |
LAN |
Prometheus and Grafana Loki |
No |
NonSecureWAN |
WAN |
Prometheus and Grafana Loki |
No |
SecureLAN |
LAN |
Prometheus and Grafana Loki |
Yes |
SecureWAN |
WAN |
Prometheus and Grafana Loki |
Yes |
NonSecureOTelLAN |
LAN |
Multiple through OpenTelemetry Collector |
No |
NonSecureOTelWAN |
WAN |
Multiple through OpenTelemetry Collector |
No |
SecureOTelLAN |
LAN |
Multiple through OpenTelemetry Collector |
Yes |
SecureOTelWAN |
WAN |
Multiple through OpenTelemetry Collector |
Yes |
For additional information on how to use the Docker image included with Collector Service, refer to Docker’s Collector Service article.
3.2. Future releases
3.2.1. Collector Service
3.2.1.1. Executable
In future releases, Collector Service will be provided as a standalone executable without using Docker to deploy.
3.2.1.2. Collector Service Deployments
As you roll out telemetry data collection and distribution across all your Connext applications, Observability Framework must be deployed in a way that supports the additional load. A single layer Collector Service deployment, as shown in Figure 3.4 Single Layer Collector Deployment and Figure 3.5 Single Layer Collector Deployment using OpenTelemetry Collector, may not scale sufficiently.
A better deployment option would be the layered deployment depicted in Figure 3.6 Layered Collector Deployment and Figure 3.7 Layered Collector Deployment Using OpenTelemetry Collector. In this option, you have multiple layers of Collector Service gathering, filtering, and forwarding the telemetry data produced by the Connext applications. Each intermediate layer reduces the number of egress points required to send data and provides an opportunity to filter telemetry data. The last layer works as a storage layer and is responsible for storing the telemetry data into a third-party observability backend.
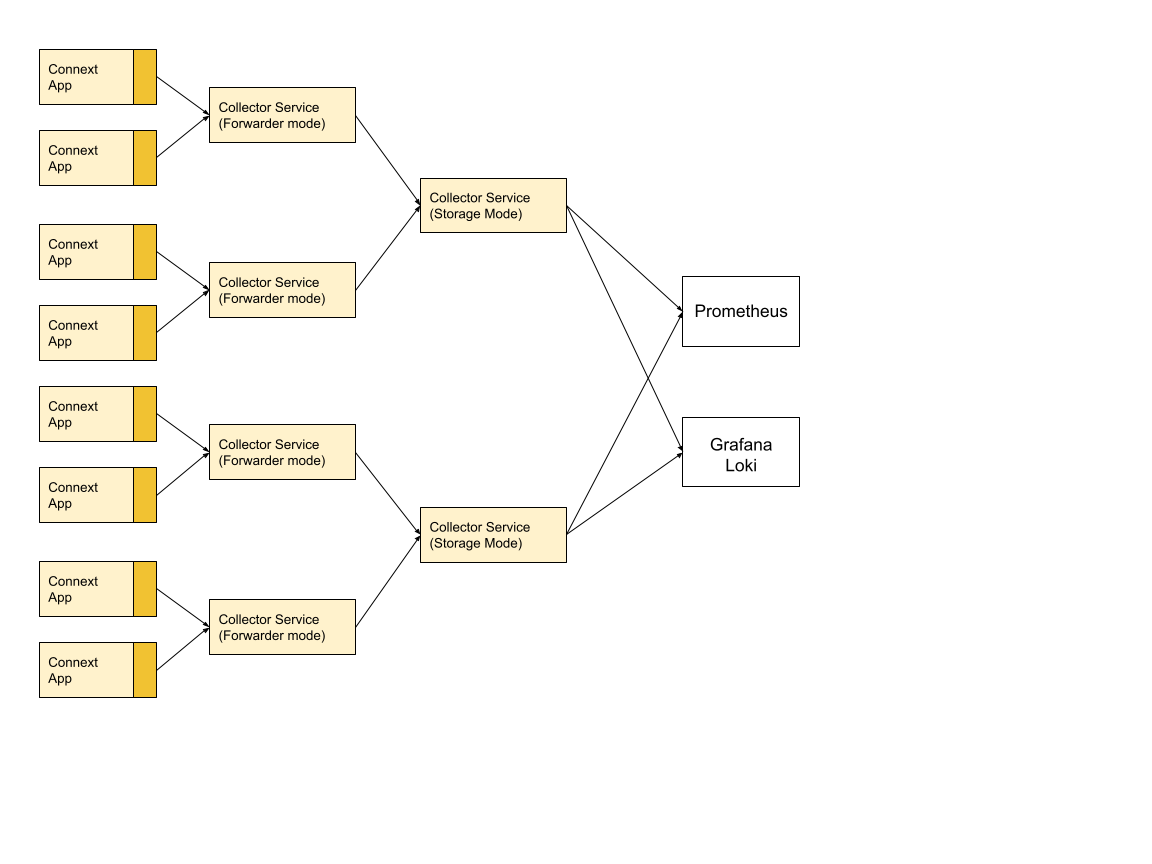
Figure 3.6 Layered Collector Deployment
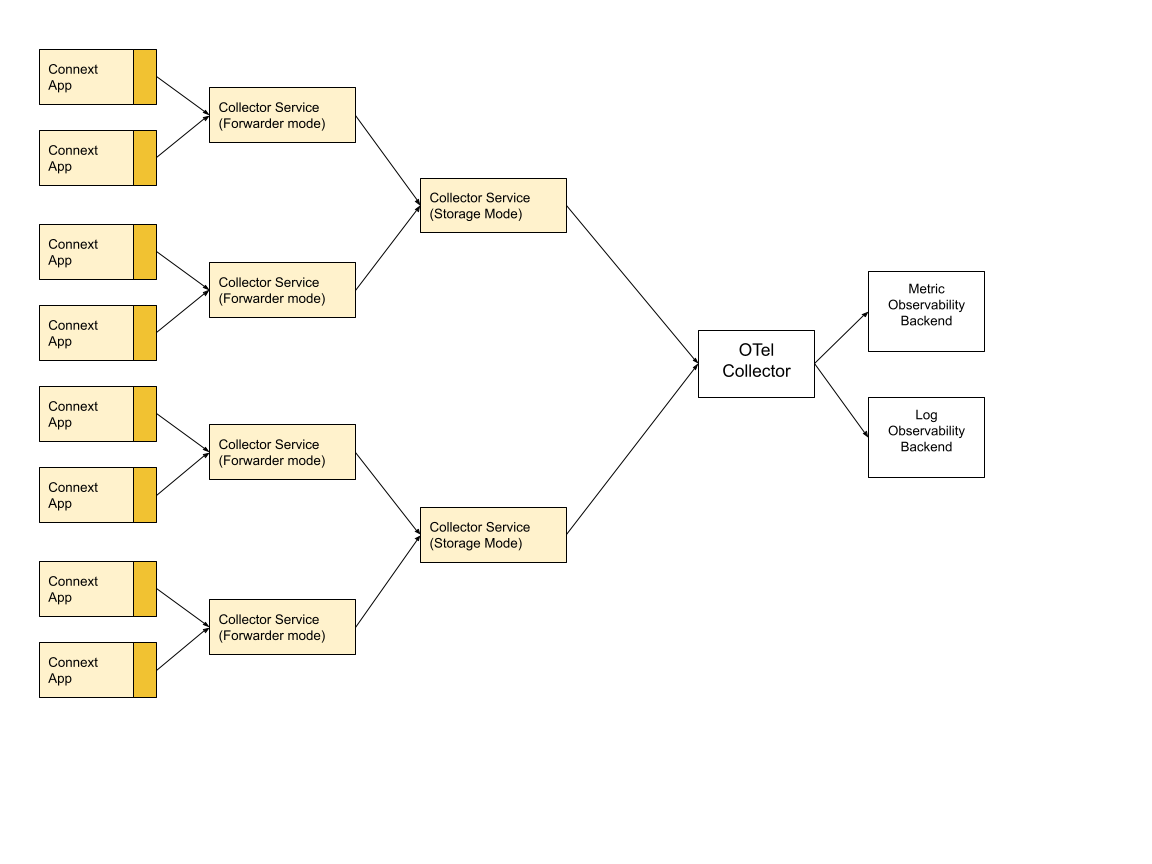
Figure 3.7 Layered Collector Deployment Using OpenTelemetry Collector