2. Components
Connext Observability Framework consists of three RTI components:
RTI Monitoring Library 2.0 enables you to instrument a Connext application to forward telemetry data. The library also accepts remote commands to change the set of forwarded metrics and logs at runtime.
RTI Collector Service collects and aggregates telemetry data from multiple applications and forwards it to backends for storage, makes it available to Admin Console for remote debugging, or relays it to other Collector Service instances for broader distribution.
RTI Observability Dashboards enable you to visualize and alert based on the Connext application metrics, as well as display Connext log messages.
To support the operational monitoring use case, Observability Framework requires third-party components to store and visualize telemetry data. This release provides native integration with Prometheus for metrics storage, Grafana Loki for logs storage, and Grafana for visualization. Integration with other third-party components is also possible when using OpenTelemetry and the OpenTelemetry Collector.
Observability Dashboards are provided as a set of Grafana dashboards to be deployed on a Grafana server. These dashboards only work with the Prometheus and Grafana Loki backends. Future releases could support other backends.
Figure 2.1 shows a simple representation of how Observability Framework components work together.

Figure 2.1 Observability Framework Components
2.1. Monitoring Library 2.0
Monitoring Library 2.0 includes the following key features:
Collection and forwarding of Connext observables (metrics and non-metric observables) and logs (including security event logs).
Configuration using MONITORING QosPolicy (DDS Extension). The QoS policy can be set programmatically or via XML.
Runtime changes to the collection and forwarding of metrics and logs using remote commands from Collector Service.
Ability to enable and disable use of Monitoring Library 2.0 at runtime by changing the Monitoring QoS policy.
Lower overhead as compared to using the RTI Monitoring Library.
For more information, see Monitoring Library 2.0.
2.2. Collector Service
Collector Service scalably collects and distributes telemetry data forwarded by Monitoring Library 2.0 in a Connext application. Collector Service is distributed as a Docker™ image.
Collector Service includes the following key features:
Collecting and distributing telemetry data forwarded by Connext applications (using Monitoring Library 2.0) or other collectors.
Sending telemetry data for storage to Prometheus for metrics and Grafana Loki for logs and security events.
Ability to send telemetry data to an OpenTelemetry Collector using the OpenTelemetry protocol (OTLP). This feature enables integration with third-party observability backends other than Prometheus and Grafana Loki.
Remote command forwarding from Observability Dashboards to the Connext applications and other resources to which the commands are directed. Remote commands may be used to control the forwarding of log messages and metrics. For detailed information on the commands supported see Collector Service REST API Reference.
Sending of observables to the RTI Admin Console for remote debugging using a WebSocket API.
For more information about the image, see the Collector Service article in Docker Hub.
2.2.1. Supported Endpoints
Collector Service receives data by instantiating receiver endpoints, and it forwards data by instantiating exporter endpoints.
Currently, the only supported receiver endpoint is a DDS receiver endpoint, which receives telemetry data from Monitoring Library 2.0 in a Connext application or from another Collector Service instance.
The following exporter endpoints are supported:
Prometheus exporter, which exports metrics to a Prometheus server.
Grafana Loki exporter, which exports logs to a Grafana Loki server.
OTLP exporter, which exports metrics and logs to an OpenTelemetry Collector using the OpenTelemetry protocol (OTLP).
WebSocket exporter, which provides observables to RTI Admin Console for remote debugging using a WebSocket API.
DDS exporter, which forwards telemetry data to another Collector Service instance.
Note
The Websocket API provided by Collector Service is not publicly available in this release.
When configured with both a DDS receiver and a DDS exporter, Collector Service acts as a forwarder, receiving telemetry from Connext applications and relaying it to another Collector Service instance. This configuration allows for scalable distribution of telemetry data across multiple Collector Service instances.
2.2.2. Built-in Configurations
The Collector Service Docker image includes a set of built-in configurations. These automatically set up Collector Service with a DDS receiver and various exporters, depending on the selected configuration.
The built-in configurations available in this release are listed in Table 2.1.
Configuration Name |
Supported Exporter(s) |
Network |
Security |
|---|---|---|---|
NonSecureForwarderLANtoLAN |
dds_exporter |
LAN to LAN |
No |
NonSecureForwarderLANtoWAN |
dds_exporter |
LAN to WAN |
No |
NonSecureForwarderWANtoWAN |
dds_exporter |
WAN to WAN |
No |
SecureForwarderLANtoLAN |
dds_exporter |
LAN to LAN |
Yes |
SecureForwarderLANtoWAN |
dds_exporter |
LAN to WAN |
Yes |
SecureForwarderWANtoWAN |
dds_exporter |
WAN to WAN |
Yes |
NonSecureLAN |
prometheus_exporter, loki_exporter, websocket_exporter |
LAN |
No |
NonSecureWAN |
prometheus_exporter, loki_exporter, websocket_exporter |
WAN |
No |
SecureLAN |
prometheus_exporter, loki_exporter, websocket_exporter |
LAN |
Yes |
SecureWAN |
prometheus_exporter, loki_exporter, websocket_exporter |
WAN |
Yes |
NonSecureOTelLAN |
otlp_exporter, websocket_exporter |
LAN |
No |
NonSecureOTelWAN |
otlp_exporter, websocket_exporter |
WAN |
No |
SecureOTelLAN |
otlp_exporter, websocket_exporter |
LAN |
Yes |
SecureOTelWAN |
otlp_exporter, websocket_exporter |
WAN |
Yes |
NonSecureRemoteDebuggingLAN |
websocket_exporter |
LAN |
No |
NonSecureRemoteDebuggingWAN |
websocket_exporter |
WAN |
No |
SecureRemoteDebuggingLAN |
websocket_exporter |
LAN |
Yes |
SecureRemoteDebuggingWAN |
websocket_exporter |
WAN |
Yes |
2.2.3. Third-Party Components
Collector Service includes native integration with Prometheus and Grafana Loki to store metrics and logs (including security events), respectively.
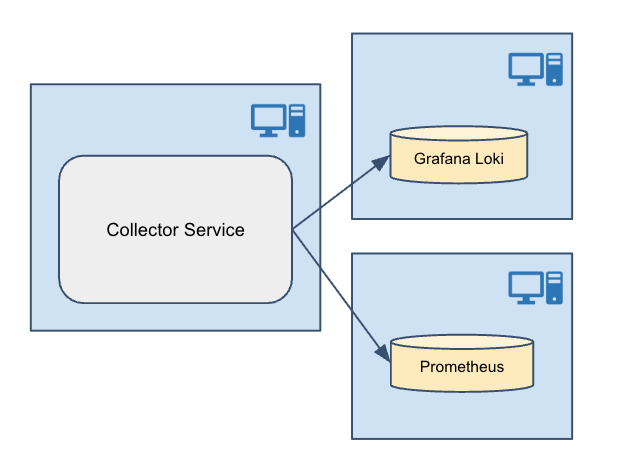
Figure 2.2 Native Integration
This release also allows integrating with other third-party storage components using OpenTelemetry and the OpenTelemetry Collector.
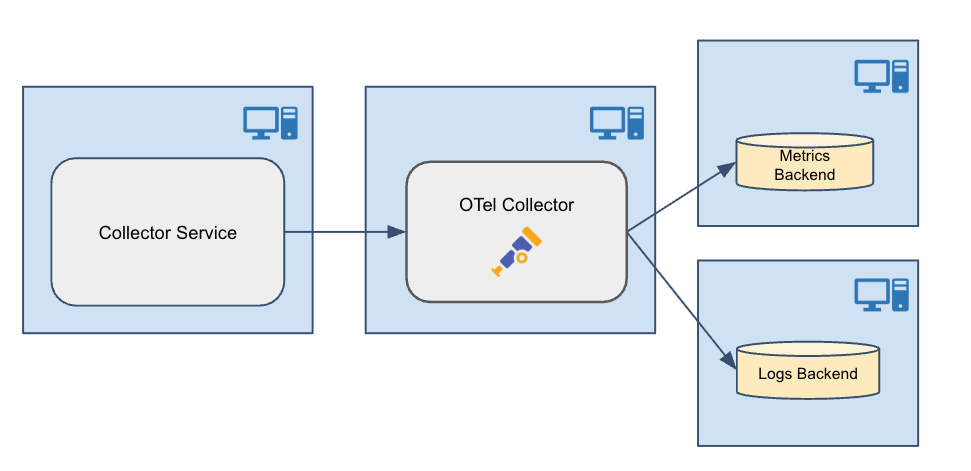
Figure 2.3 OpenTelemetry Integration
2.3. Observability Dashboards
A set of hierarchical Grafana dashboards displays alerts when a problem occurs and provides visualizations to help perform root cause analysis. The dashboards get the telemetry data from a Prometheus server and the logs from a Grafana Loki server, supporting the operational monitoring use case.
For more information, see the Observability Dashboards chapter.