1. Introduction to Connext Observability Framework
RTI® Connext® Observability Framework is a holistic solution that uses telemetry data to provide deep visibility into the current and past states of your Connext applications. This visibility makes it easier to proactively identify and resolve potential system issues, providing a higher level of confidence in the reliable operation of the system.
Observability Framework is part of Connext Professional.
1.1. Use Cases
Real-Time Remote Debugging. The framework delivers real-time access to telemetry data generated by Connext applications, including logs, Quality of Service (QoS) configurations, entity status changes (for example, liveliness or dropped samples), and discovery events. Developers can quickly correlate system behavior with this data to identify the precise cause and context of anomalies and failures. Debugging data is typically distributed within milliseconds and is not stored long-term, as it is primarily used for immediate troubleshooting in RTI Admin Console.
Operational Monitoring. The framework enables continuous system health and performance monitoring through metrics (for example, throughput), logs, and security events. It integrates seamlessly with observability backends and dashboard tools like Prometheus® and Grafana®, offering intuitive visualizations and proactive alerting to maintain operational excellence. Operational monitoring data is typically generated every few seconds to minutes and stored in time-series databases or log aggregators for long-term analysis.
1.2. How Observability Framework Works
The RTI components (Monitoring Library 2.0, Collector Service) that make up the framework work together to collect and distribute Connext application telemetry data. The following figure illustrates the high-level architecture of the framework and the data flow between components.
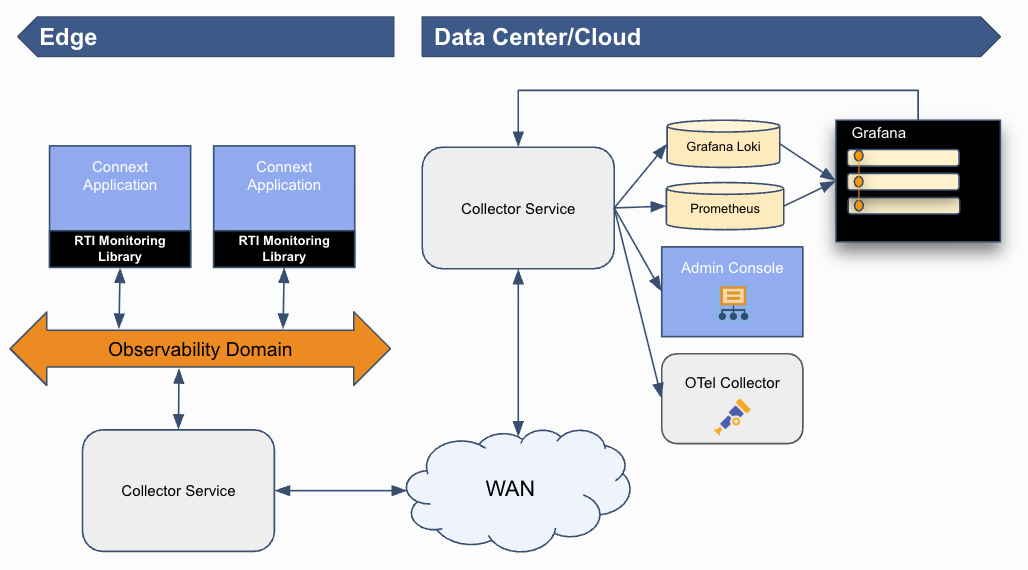
1.2.1. Distribution of Telemetry Data
Each Connext application is instrumented with Monitoring Library 2.0, which collects telemetry data and sends it to a Collector Service instance. This service can forward the data directly to telemetry backends and monitoring tools, or relay it to other Collector Service instances for further distribution.
For details on telemetry data distribution, see the Monitoring Library 2.0 and Collector Service chapters.
1.2.2. Telemetry Backends
To support the operational monitoring use case, Observability Framework requires third-party components to store and visualize telemetry data. This release provides native integration with Prometheus for metrics storage, Grafana Loki for logs storage, and Grafana for visualization. Integration with other third-party components is also possible when using OpenTelemetry and the OpenTelemetry Collector.
For more information, see the Collector Service chapter.
1.2.3. Remote Debugging
Collector Service can be configured to provide telemetry data to RTI Admin Console via a WebSocket API. This configuration enables real-time debugging of Connext systems, even when they are running across different networks.
For more information, see Remote Debugging in the RTI Admin Console User’s Manual.
1.2.4. Control and Selection of Telemetry Data
Distributed system components can generate large volumes of telemetry data, but not all of it is necessary for effective problem detection. Observability Framework enables you to control the amount of telemetry data that is generated, forwarded, and stored. You can manage these settings at run-time and via an initial configuration.
For metrics, logs, and security events sent to third-party backends, you can manage the data flow using the Collector Service REST API.
For telemetry data sent to Admin Console, data is collected and forwarded only when Admin Console is actively consuming it.
1.2.5. Security
The Observability Framework provides mechanisms to secure the telemetry data generated by Connext applications and forwarded to telemetry backends or Admin Console.
Data in transit is secured using the RTI Security Plugins and Basic authentication over HTTPS.
Data at rest is secured by the respective third-party telemetry backends.
For more details, see the Security chapter.
1.3. Components
Connext Observability Framework consists of three RTI components:
RTI Monitoring Library 2.0 enables you to instrument a Connext application to forward telemetry data. The library also accepts remote commands to change the set of forwarded metrics and logs at runtime.
RTI Collector Service collects and aggregates telemetry data from multiple applications and forwards it to backends for storage, makes it available to Admin Console for remote debugging, or relays it to other Collector Service instances for broader distribution.
RTI Observability Dashboards for evaluation purposes enable you to visualize and alert based on the Connext application metrics, as well as display Connext log messages.
1.3.1. Monitoring Library 2.0
Monitoring Library 2.0 includes the following key features:
Collection and forwarding of Connext observables (metrics and non-metric observables) and logs (including security event logs).
Configuration using MONITORING QosPolicy (DDS Extension). The QoS policy can be set programmatically or via XML.
Runtime changes to the collection and forwarding of metrics and logs using remote commands from Collector Service.
Ability to enable and disable use of Monitoring Library 2.0 at runtime by changing the Monitoring QoS policy.
Lower overhead as compared to using the RTI Monitoring Library.
For more information, see Monitoring Library 2.0.
1.3.2. Collector Service
Collector Service includes the following key features:
Collecting and distributing telemetry data forwarded by Connext applications (using Monitoring Library 2.0) or other collectors.
Sending telemetry data for storage to Prometheus for metrics and Grafana Loki for logs and security events.
Ability to send telemetry data to an OpenTelemetry Collector using the OpenTelemetry protocol (OTLP). This feature enables integration with third-party observability backends other than Prometheus and Grafana Loki.
Remote command forwarding from Observability Dashboards to the Connext applications and other resources to which the commands are directed. Remote commands may be used to control the forwarding of log messages and metrics. For detailed information on the commands supported see REST API Reference.
Sending of observables to the RTI Admin Console for remote debugging using a WebSocket API.
For more information, see Collector Service.
1.3.3. Observability Dashboards
A set of hierarchical Grafana dashboards is included with Observability Framework for evaluation purposes. These dashboards display alerts when a problem occurs and provide visualizations to help perform root cause analysis. The dashboards get the telemetry data from a Prometheus server and the logs from a Grafana Loki server, supporting the operational monitoring use case.
Observability Dashboards are provided as a set of Grafana dashboards to be deployed on a Grafana server. These dashboards only work with the Prometheus and Grafana Loki backends. Future releases could support other backends.
For more information, see the Observability Dashboards chapter.
1.4. Telemetry Data
Telemetry data provides insight into the internal state and behavior of Connext applications. Telemetry data can be generated at the application, middleware, and system levels. Regardless of the level, telemetry data can be categorized as observables (such as metrics), logs, security events, or traces.
Important
In this release, Observability Framework only supports middleware telemetry (observables, logs, and security events) and application logs.
For details, see the Telemetry Data chapter.