AI Agents#
Introduction#
What you’ll learn
In this module, you’ll use Connext Studio to inspect a live Connext Cloud Databus and create an AI-generated data view.
You will do the following:
Set up an edge system connected to a Connext Cloud Databus, or reuse one from a previous module
Add the Databus to Connext Studio as a data source
Open a live system view of participants, Topics, DataWriters, and DataReaders
Use AI to generate a live data view from Databus Topics
Try additional AI prompts against the running system
In this module, your computer runs Visual Studio Code with the Connext Studio extension. Connext Studio connects to a Connext Cloud Databus with live edge data. You can continue from the Cloud Data Streaming or Cloud Observability modules, or set up the system from scratch in the first step.
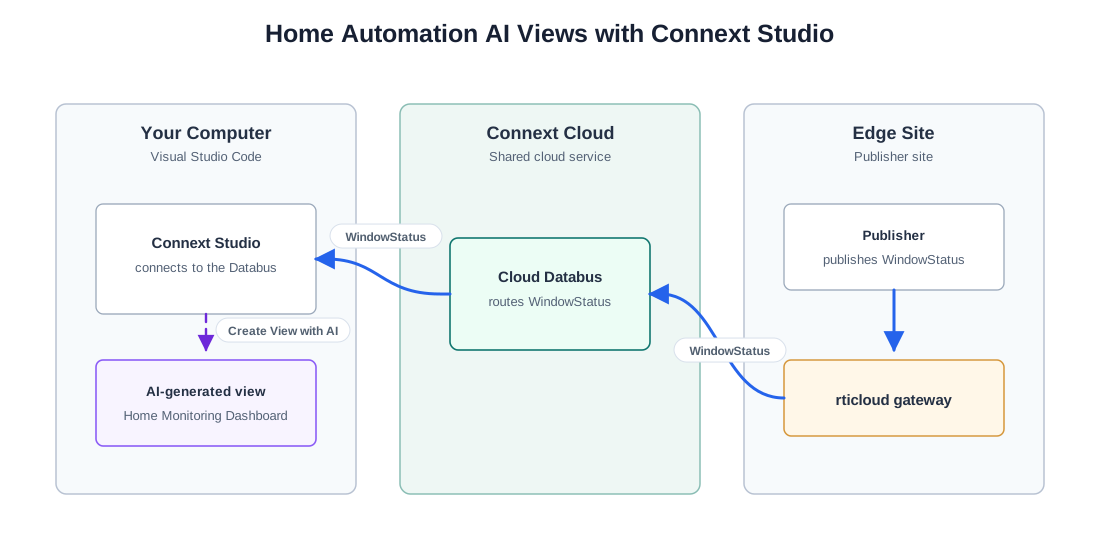
Connext Studio creating an AI view from a live Connext Cloud Databus.#
How to complete this module#
To complete this module, you’ll need the following:
A free Connext Cloud account.
A Connext application and an
rticloud gatewayconnected to a Connext Cloud Databus. The first step shows how to set this up. RTI recommends running them on a different machine than Connext Studio, but everything can also run on your own machine.Visual Studio Code with the Connext Studio extension installed on your computer.
A Connext installation on your computer. Connext Studio uses it to run the local tools that connect to the Databus. If Connext is not installed, the Connext Studio welcome screen will guide you through installing an evaluation version.
1. Set up the system to inspect#
We recommend running the edge application and its gateway on a separate machine from Connext Studio to inspect a real distributed system. However, all components can also run on your own machine.
Choose your starting point:
Follow steps 1 through 4 of the Cloud Data Streaming module to
run the home automation publisher, create home-automation-databus,
and connect a gateway. When you run rticloud gateway, choose
Data and Observability to connect both the Databus and the Observability Service.
If you want to try a larger, more realistic system, on a separate machine, clone one of the following repositories and follow the instructions to run a large simulation:
Once you have the simulation running, follow the instructions in the Cloud Data Streaming module to create a Databus and run a gateway on that machine.
2. Open Connext Studio#
Open Visual Studio Code on your computer.
Open Connext Studio from the VS Code Side Bar. You can also open the Command Palette and run View: Show Connext Studio, or click here to open it.
The Connext Cloud integration in Connext Studio is a Preview feature and is disabled by default. To enable it, go to Account & Support > Settings > Advanced Settings > Connext and select Connext Cloud Enabled. The Connext Cloud section then appears in the Connext Studio panel.
In the Connext Studio panel, expand the Connext Cloud section and select Log in to Connext Cloud. After authentication, the Connext Cloud section shows your Databuses and Observability Services.
3. Add Connext Cloud data sources#
In the Connext Cloud section of Connext Studio, select the Connect button (plug icon) next to the Databus you want to inspect. The Databus is added as a data source in the Data Sources section.
For the home automation walkthrough, connect home-automation-databus.
Do the same for the Observability Service.
Wait for Connext Studio to connect and discover the running participants, Topics, DataWriters, and DataReaders.
4. Open the system view#
After the Databus source is connected, go to the Views section and select System Visualization (under System Views).
Use the system view to inspect the live topology. For the home automation Databus, confirm that Studio can see:
The “WindowStatus” Topic
A publisher-side DataWriter
A subscriber-side DataReader, if the subscriber is running
The edge gateway connected to the Databus
This view will update as new participants, Topics, DataWriters, and DataReaders are added or removed from the system.
5. Create a view with AI#
In the Views section, select Create View with AI. Describe the view you want to generate from the live Databus data.
If you are using the home automation example, try:
Create a Home Monitoring Dashboard that visualizes data from the
WindowStatus topic. For each window, render a card showing the room name,
sensor name, current status, and a corresponding window icon. Use a red
alarm style for open windows and a green shield style for closed windows.
Keep the edge application running while the view is open. New samples should update the generated view as data arrives.
6. Additional experimentation#
After the first view works, use the AI chat to refine the result or investigate the live system. You can update a generated view with:
/updateView your-description
Try these prompts:
Explain the live Databus topology. Include the Databus, connected edge
gateways, Topics, DataWriters, and DataReaders that Connext Studio can see.
Summarize the live endpoints for WindowStatus. Show which DataWriters and
DataReaders are matched and whether any QoS or discovery issue would prevent
data from flowing.
Group the WindowStatus samples by sensor_name and room_name. Identify which
sensors are currently open and which ones have not updated recently.
Write a short handoff note for this Databus. Include the active Databus
name, visible Topics, connected edge sites, and any live data values that
are useful for an operator.
Learn more#
This module showed how to use Connext Studio with a live Connext Cloud Databus. The edge applications and gateways stayed unchanged while Studio discovered the system topology and generated an AI-assisted data view.
Next Steps
Related modules:
Cloud Data Streaming. Build a Cloud Databus you can inspect with Connext Studio.
Cloud Observability. Monitor an edge site with Connext Cloud Observability.
