Data Visualization#
Introduction#
What you’ll learn
In this module, you’ll learn how to visualize the data in your system using Connext command-line and graphical tools.
You will do the following:
Run an application with multiple Topics and data types
Use RTI DDS Spy (rtiddsspy) to visualize discovered entities and published data
Use Admin Console to visualize your Connext system
How to complete this module#
To complete this module, you’ll need the following:
20-30 minutes
A Connext installation (full installation). See Get Started.
It’s recommended to have completed the Publish-Subscribe module, but not required.
This module uses the code from the Publish a second topic to notify alerts optional exercise in the Publish-Subscribe module. The code is available in RTI’s GitHub examples repository.
Cloning the GitHub repository
Clone the GitHub repository with the following command:
$ git clone --recurse-submodule https://github.com/rticommunity/rticonnextdds-examples.git
The code for this module is located in the tutorials/publish_subscribe
directory. See the README.md files for additional instructions.
This guide is designed for Connext 7.7.0 or newer. For Connext 7.3.1, checkout the branch release/7.3.1.
1. Run the applications#
We’ll use the code from the the Publish a second topic to notify alerts optional exercise in the Publish-Subscribe module. This exercise uses two Topics and a key-value type.
Launch the following applications in separate terminal windows:
Terminal 1 - run a sensor publisher application:
python home_automation_publisher.py
Terminal 2 - run a second publisher:
python home_automation_publisher.py Window2 Kitchen
Temrinal 3 - run the home alerts application:
python home_alerts.py
Build the applications by following the instructions in the README.md <rticommunity/rticonnextdds-examples>_ from the tutorials/publish_subscribe/c++11 directory.
Terminal 1 - run a sensor publisher application:
./build/home_automation_publisher
Terminal 2 - run a second publisher:
./build/home_automation_publisher Window2 Kitchen
Terminal 3 - run the home alerts application
./build/home_alerts
You shouldn’t see any output yet. In the next steps, you’ll use rtiddsspy and Admin Console to visualize the system.
2. Visualize data with rtiddsspy#
RTI DDS Spy (rtiddsspy) is a command-line tool that allows subscribing to and inspecting any Topic. It includes command-line arguments that help in filtering or structuring specific data to your liking.
With your publisher and subscriber applications still running, launch rtiddsspy.
<connext installation>/bin/rtiddsspy
You’ll see the following output:
RTI Connext DDS Spy built with DDS version:
~~~~~~~~~~~~~~~~~~~~~~~~~~~~~~~~~~~~~~~~~~
rtiddsspy is listening for data, press CTRL+C to stop it.

20:34:22 New writer        from 172.16.0.2      : topic="HomeAlerts" type="KeyedString"
20:34:15 New writer        from 172.16.0.2      : topic="WindowStatus" type="DeviceStatus"
20:33:56 New writer        from 172.16.0.2      : topic="WindowStatus" type="DeviceStatus"
20:34:22 New reader        from 172.16.0.2      : topic="WindowStatus" type="DeviceStatus"
20:43:59 New data          from 172.16.0.2      : topic="WindowStatus" type="DeviceStatus"
20:43:59 New data          from 172.16.0.2      : topic="WindowStatus" type="DeviceStatus"
20:43:59 New data          from 172.16.0.2      : topic="HomeAlerts" type="KeyedString"
20:44:01 New data          from 172.16.0.2      : topic="HomeAlerts" type="KeyedString"
20:44:01 Modified instance from 172.16.0.2      : topic="WindowStatus" type="DeviceStatus"
20:44:01 Modified instance from 172.16.0.2      : topic="WindowStatus" type="DeviceStatus"


---- Statistics ----
Discovered 3 DataWriters and 1 DataReaders
Received samples (Data, Dispose, NoWriters):
        2, 0, 0         (Topic="HomeAlerts"  Type="KeyedString")
        4, 0, 0         (Topic="WindowStatus"  Type="DeviceStatus")
The output includes the timestamp, type of event, source address, Topic, and type. When you close rtiddsspy, it prints a summary of this information; the summary includes the number of DataReaders and DataWriters that were discovered, and the number of updates received per Topic.
Some updates are labeled “new data” and some “modified instance.” Both
are updates for a Topic; however, “new data” indicates that the instance
(identified by the key) is new. In this example, these are new instances of the
WindowStatus and HomeAlerts Topics (identified by the
sensor_name and key fields, respectively) that rtiddsspy hasn’t
seen before.
To see the contents of each data sample, run rtiddsspy with the
-printSample argument:
<connext installation>/bin/rtiddsspy -printSample
You’ll see the following output:
RTI Connext DDS Spy built with DDS version:
~~~~~~~~~~~~~~~~~~~~~~~~~~~~~~~~~~~~~~~~~~
rtiddsspy is listening for data, press CTRL+C to stop it.

20:34:22 New writer        from 172.16.0.2      : topic="HomeAlerts" type="KeyedString"
20:34:15 New writer        from 172.16.0.2      : topic="WindowStatus" type="DeviceStatus"
20:33:56 New writer        from 172.16.0.2      : topic="WindowStatus" type="DeviceStatus"
20:34:22 New reader        from 172.16.0.2      : topic="WindowStatus" type="DeviceStatus"
20:51:26 New data          from 172.16.0.2      : topic="HomeAlerts" type="KeyedString"
key: "Window1"
value: "Window in LivingRoom was just opened"

20:51:26 New data          from 172.16.0.2      : topic="WindowStatus" type="DeviceStatus"
sensor_name: "Window1"
room_name: "LivingRoom"
is_open: true

20:51:26 New data          from 172.16.0.2      : topic="WindowStatus" type="DeviceStatus"
sensor_name: "Window2"
room_name: "Kitchen"
is_open: false
You can filter which Topics and data types to display with the
-topicFilter <regex> and -typeFilter <regex> arguments, respectively.
For example:
<connext installation>/bin/rtiddsspy -printSample -topicRegex "HomeAlerts"
You’ll see the following output:
RTI Connext DDS Spy built with DDS version: 7.3.0
~~~~~~~~~~~~~~~~~~~~~~~~~~~~~~~~~~~~~~~~~~
rtiddsspy is listening for data, press CTRL+C to stop it.

20:34:22 New reader        from 172.16.0.2      : topic="WindowStatus" type="DeviceStatus"
20:33:56 New writer        from 172.16.0.2      : topic="WindowStatus" type="DeviceStatus"
20:34:22 New writer        from 172.16.0.2      : topic="HomeAlerts" type="KeyedString"
20:34:15 New writer        from 172.16.0.2      : topic="WindowStatus" type="DeviceStatus"
20:58:54 New data          from 172.16.0.2      : topic="HomeAlerts" type="KeyedString"
key: "Window1"
value: "Window in LivingRoom was just opened"

20:58:56 New data          from 172.16.0.2      : topic="HomeAlerts" type="KeyedString"
key: "Window2"
value: "Window in Kitchen was just opened"

20:58:58 Modified instance from 172.16.0.2      : topic="HomeAlerts" type="KeyedString"
key: "Window1"
value: "Window in LivingRoom was just opened"
Additional formatting options
You can control the display size of the Topic and type name with the
-topicWidth and -typeWidth options. You can also print the data in
a single line with -printSample COMPACT.
For additional information, such as the guid, entity name, and partitions, use -showHandle,
-showEntityName, and -showPartition, respectively.
Next, you’ll run Admin Console to gain more insights about the system. This tool is especially helpful as systems grow more complex.
3. Visualize with Admin Console#
Admin Console is a tool that helps you visualize your Connext system. With your applications still running, launch Admin Console.
<connext installation>/bin/rtiadminconsole
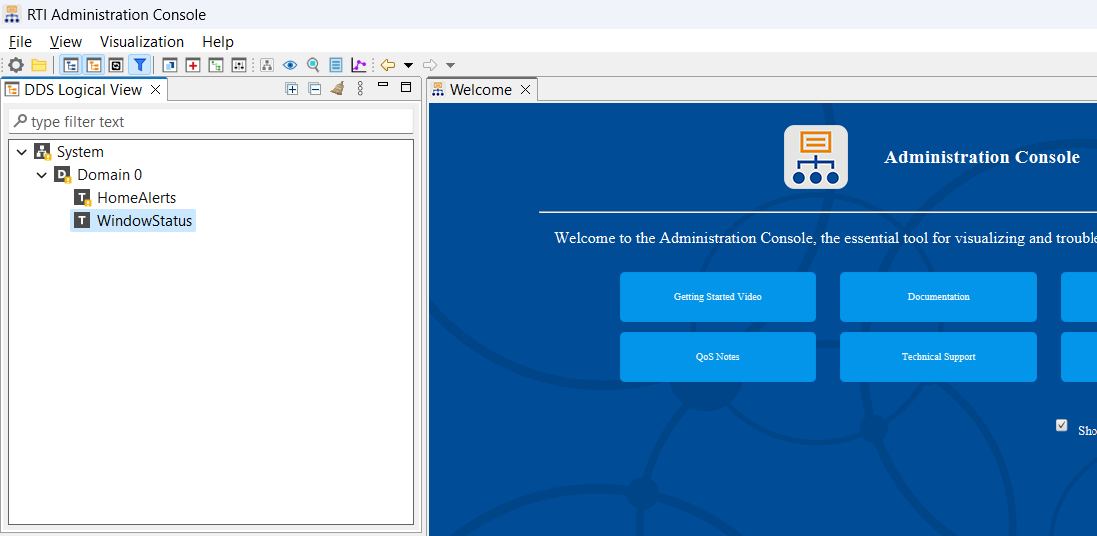
When launching Admin Console with applications running, you will see the discovered Topics in the DDS Logical View tab. Click a Topic name to open a visualization of the DataWriters and DataReaders publishing and subscribing to the Topic.
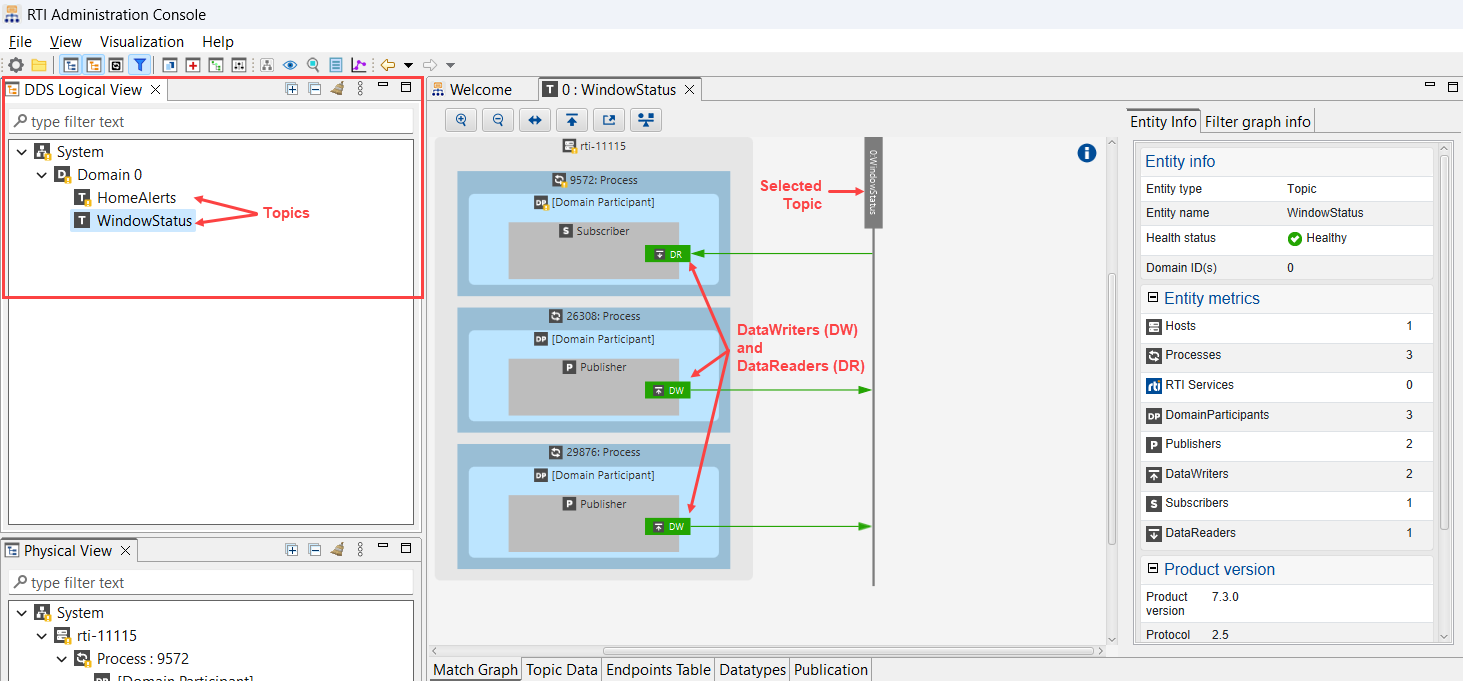
Navigate a Topic#
The following image shows a visualization of the WindowStatus Topic. In the graphical panel, note that there is a DataWriter and DataReader communicating over this Topic. To get more information about each entity, click it in the graphic. For example, click the DataWriter (DW) to see its Quality of Service, match analysis, data type, and other details in the information panels.
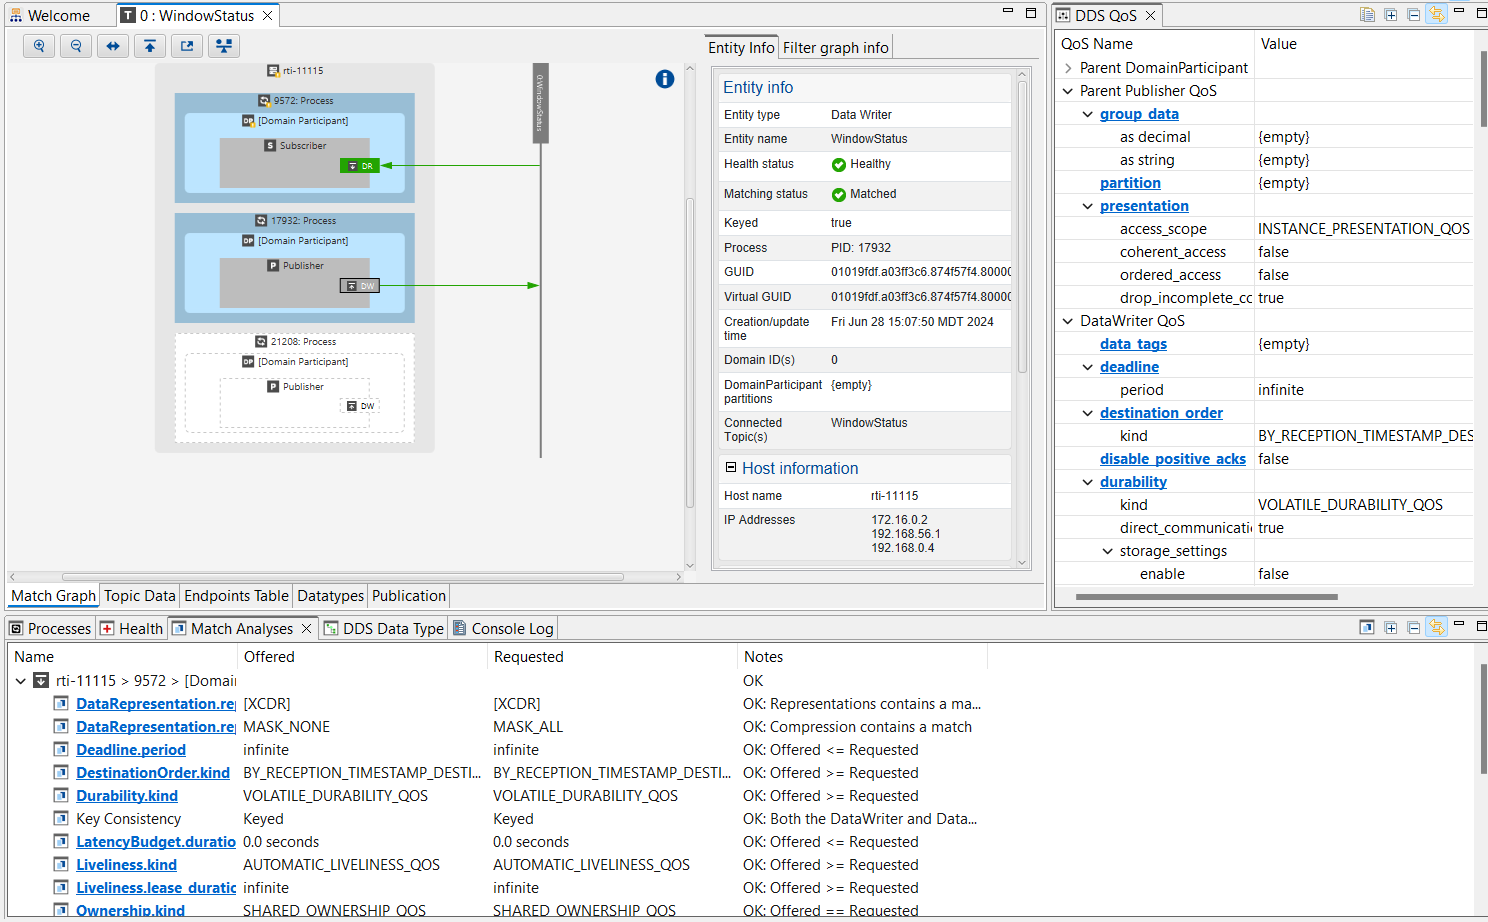
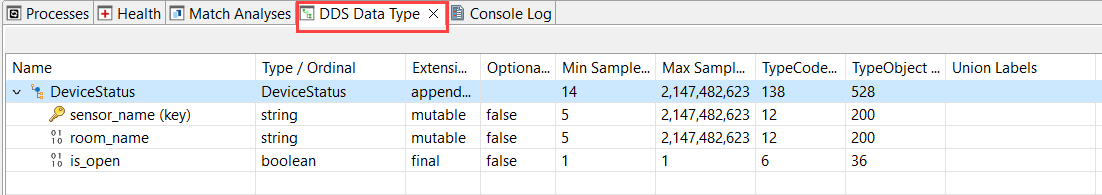
Note that some panels have multiple tabs. In the bottom panel, switch tabs from Match Analyses to DDS Data Type to see details about the data type published by the selected DataWriter on the selected Topic. The following image shows the data type as a Type Tree; select the Equivalent IDL tab to view the same information in IDL format.
Subscribe to a Topic#
Admin Console allows you to subscribe to Topics to see the current flow of published data. In the DDS Logical View, right-click the WindowStatus Topic, select “subscribe” in the context menu, then click OK. If prompted to switch to the data visualization perspective, click Yes.
Next, right-click the WidowStatus Topic and select Visualize > Sample Log. A new panel with a Sample Log # tab opens displaying the data currently being published.
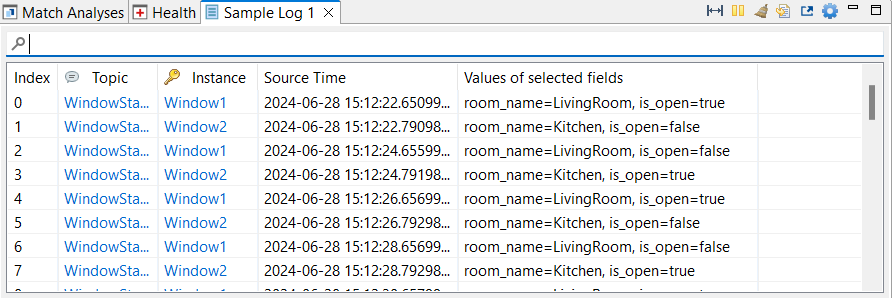
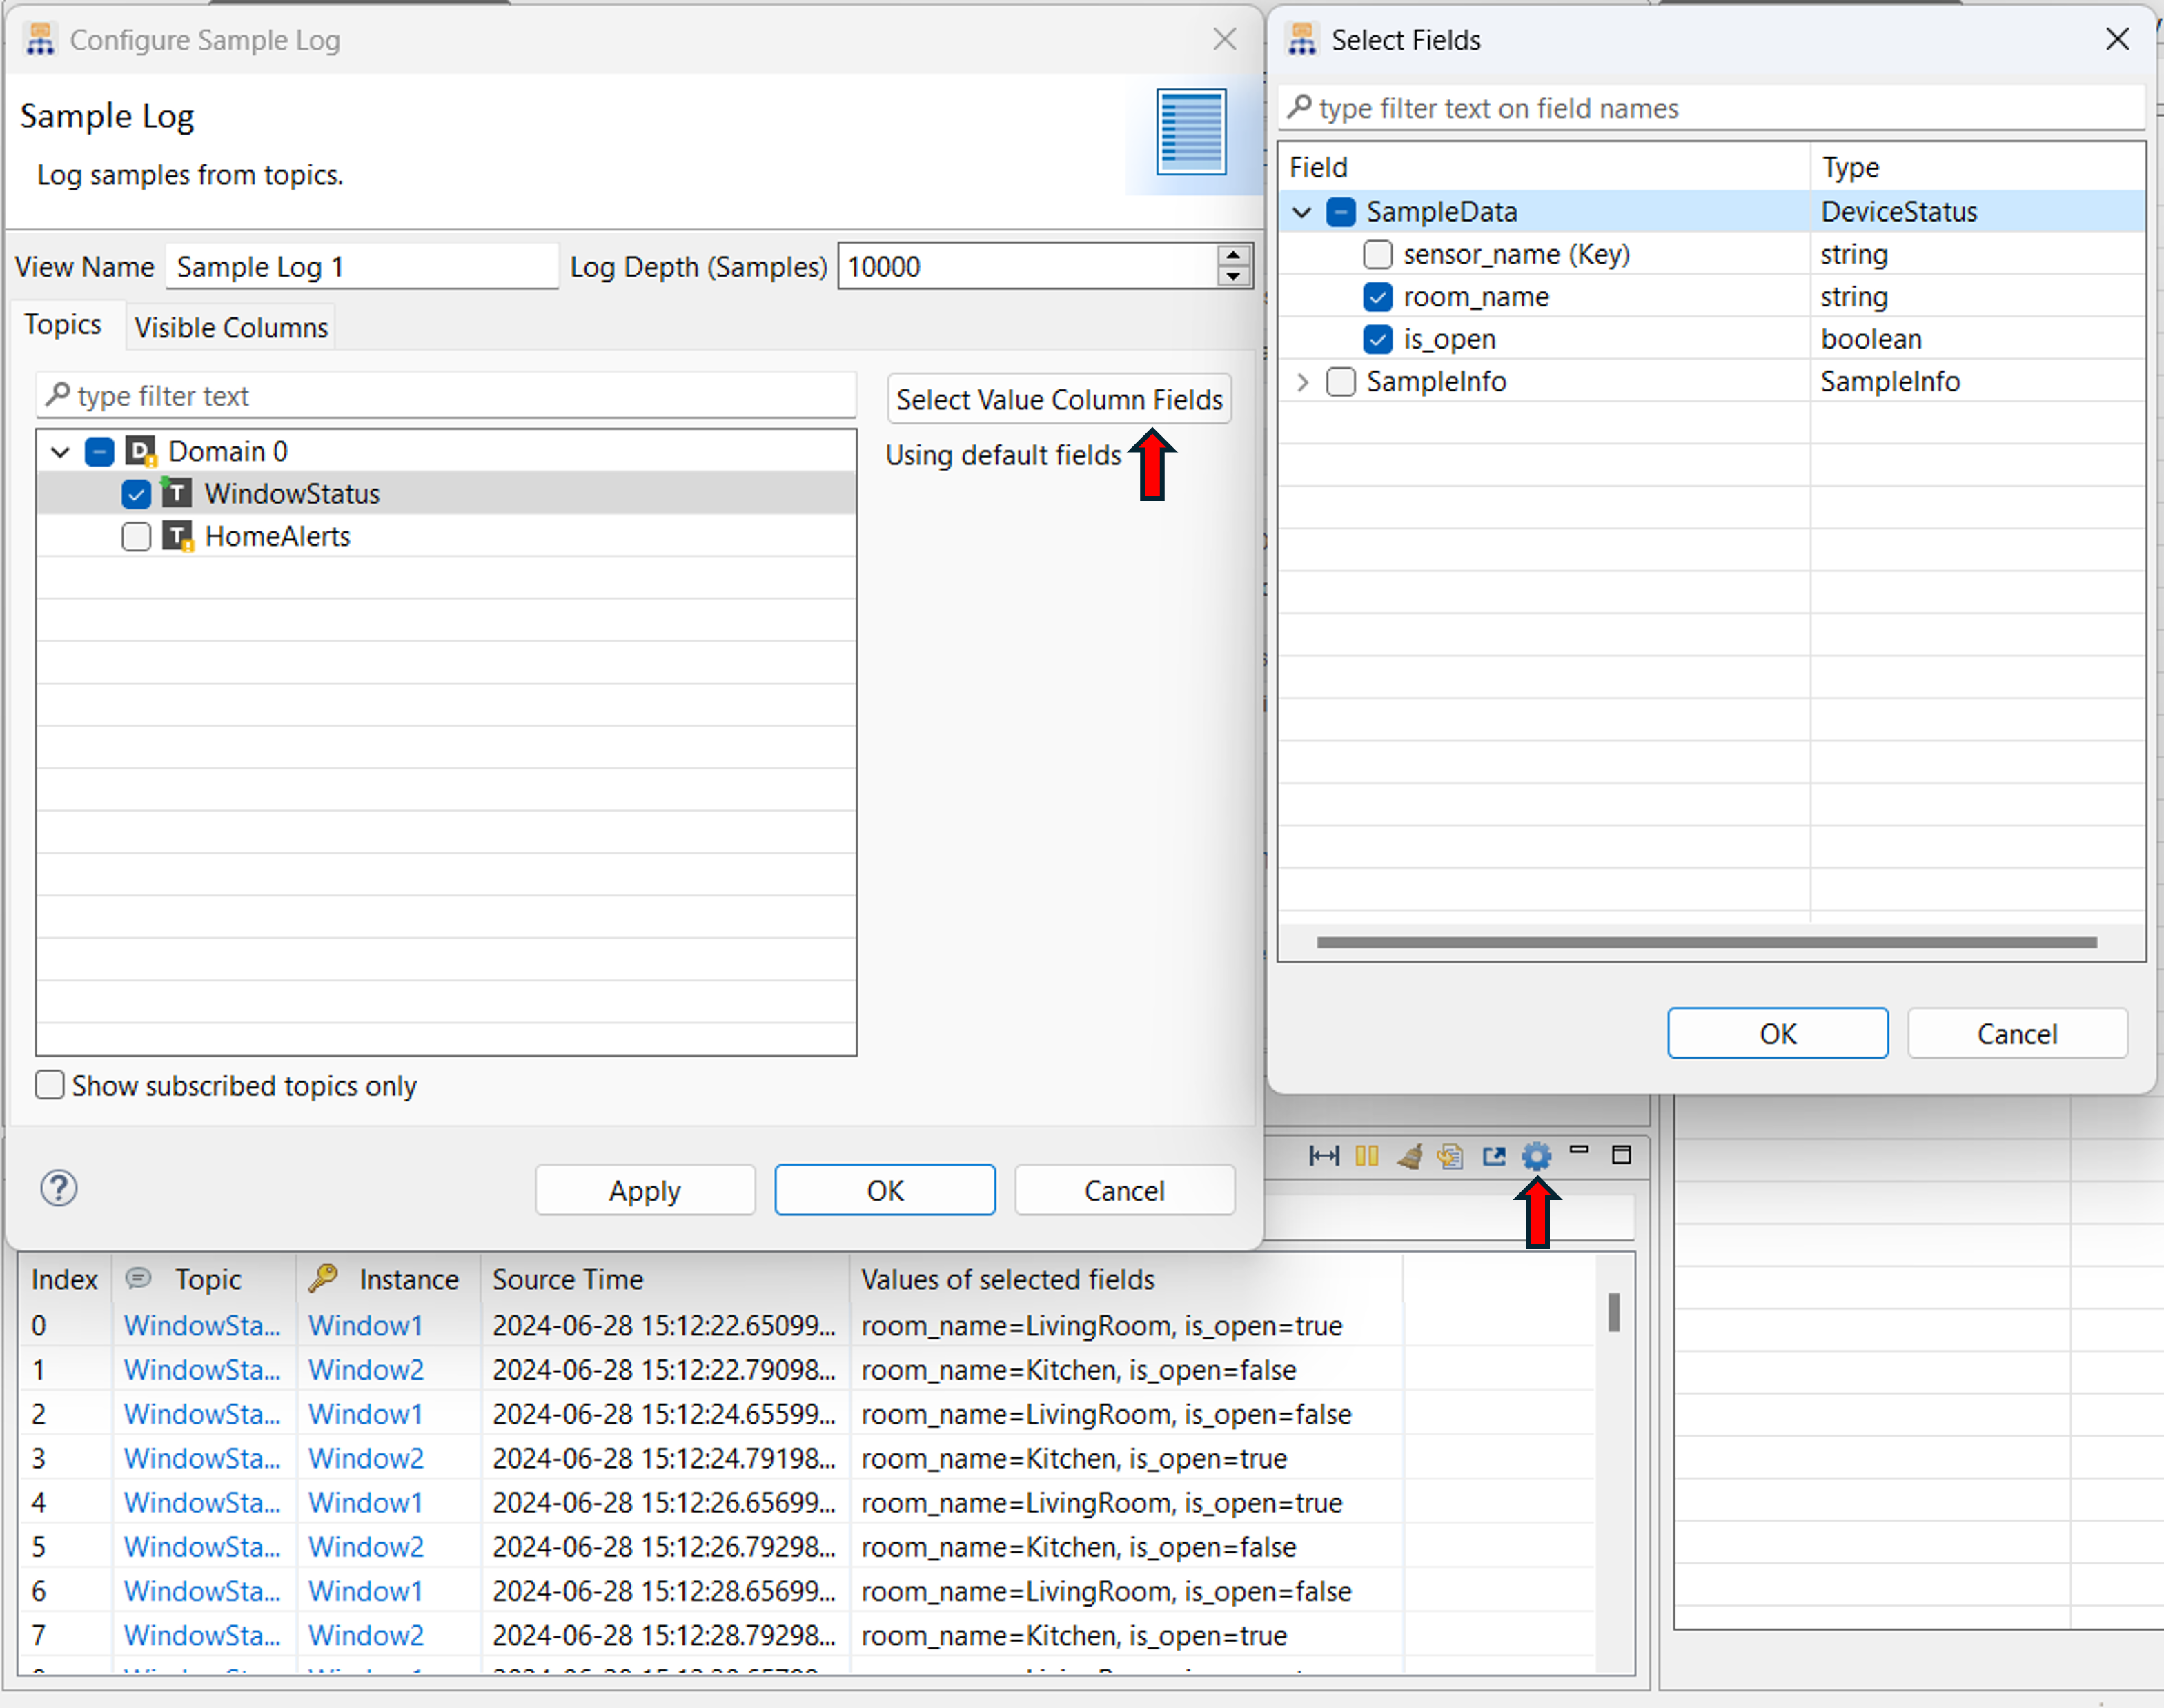
You can customize the fields displayed in the Sample Log tab. In the toolbar at the top right of the panel, click the Configure (cog) icon. In the Configure Sample Log dialog, click Select Value Column Fields. In the Select Fields dialog, select which fields to display in the Value of selected fields column, then click OK.
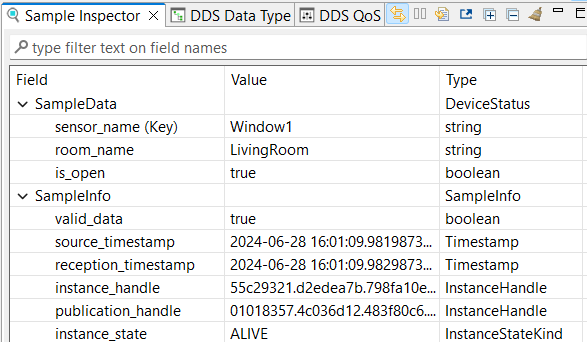
For details about a data sample, click one of the samples in the Sample Log. The Sample Inspector tab opens in the right panel, enabling you to see the data in each field and the associated SampleInfo.
Learn More#
This module introduced two Connext tools that help you visualize your application details and communications.
Next Steps
Related modules:
Debugging. This module uses rtiddsspy and Admin Console to debug communication issues.
Reference documentation:
