Debugging#
Introduction#
What you’ll learn
In this module, you’ll use Connext command-line and graphical tools to learn how to debug applications that don’t communicate as expected.
You will do the following:
Create a scenario with issues preventing communication between applications
Use rtiddsping to check basic connectivity
Use rtiddsspy to see what publishers, subscribers, and Topics are discovered
Use Admin Console to visualize the system and check its health status
Let’s review the example from the Publish-Subscribe module, where we simulated a simple home automation system that monitors sensors that indicate whether a window is open or closed.
Each sensor publishes an update to the WindowStatus Topic when the window status changes.
A monitoring application subscribes to the WindowStatus Topic and prints a warning when any window is open.
If we don’t receive data from any of the expected sensors, we’ll need to debug our application. RTI provides tools to speed up the debugging process.
How to complete this module#
To complete this module you’ll need the following:
20-30 minutes
A Connext installation (full installation). See Get Started.
A text editor or IDE to write your code.
In this module, we’ll simulate problems to debug by making small changes to the subscriber applications we created in the Publish-Subscribe module. Completing that module is recommended but not required. The code is available in RTI’s GitHub examples repository.
Cloning the GitHub repository
Clone the GitHub repository with the following command:
$ git clone --recurse-submodule https://github.com/rticommunity/rticonnextdds-examples.git
The code for this module is located in the tutorials/publish_subscribe
directory. See the README.md files for additional instructions.
This guide is designed for Connext 7.7.0 or newer. For Connext 7.3.1, checkout the branch release/7.3.1.
1. Create the scenario to debug#
Below, you’ll edit the subscriber application to introduce three issues that prevent communication between the subscriber and the publishers:
Two participants in different domain IDs. Participants need to be in the same domain ID to communicate.
Two different Topic names. A DataWriter and DataReader need to communicate over the same Topic.
QoS mismatch. The DataReader is requesting a higher level durability (transient local) than the DataWriter offers (volatile).
In the subscriber application, home_automation_subscriber.py,
update the following lines in the function sensor_monitoring():
participant = dds.DomainParticipant(domain_id=1)
topic = dds.Topic(participant, "WindowsStatus", DeviceStatus)
reader_qos = dds.QosProvider.default.datareader_qos
reader_qos.durability = dds.Durability.transient_local
reader = dds.DataReader(topic, reader_qos)
Open a terminal window and run the alert subscriber application.
python home_automation_subscriber.py
Open a second terminal window and run the alert publisher application.
python home_automation_publisher.py
In the subscriber application, home_automation_subscriber.cxx,
update the following lines in the function sensor_monitoring():
dds::domain::DomainParticipant participant(1);
dds::topic::Topic<DeviceStatus> topic(participant, "WindowStatus");
dds::sub::qos::DataReaderQos reader_qos = dds::core::QosProvider::Default().datareader_qos();
reader_qos << dds::core::policy::Durability::TransientLocal();
dds::sub::DataReader<DeviceStatus> reader(topic, reader_qos);
To build the example, follow the instructions in the Github repository.
Open a terminal window and run the alert subscriber application.
./home_automation_subscriber
Open a second terminal window and run the alert publisher application.
./home_automation_publisher
The subscriber does not receive any data—let’s debug it.
2. Check connectivity with rtiddsping#
When a subscriber does not receive data, you can use rtiddsping to test the target’s accessibility.
On IP networks, the ping utility sends ICMP packets to test a target’s reachability. rtiddsping utility works similarly, but uses the Real Time Publish Subscribe (RTPS) protocol.
Open two terminal windows to run rtiddsping.
<connext installation>/bin/rtiddsping -domainId 0 -publisher
You’ll see the following output:
RTI Connext DDS Ping built with DDS version: 7.3.0
~~~~~~~~~~~~~~~~~~~~~~~~~~~~~~~~~~~~~~~~~~
Sending data...   value: 0000000
Found 1 additional ping subscriber(s).
Current subscriber tally is: 1
Sending data...   value: 0000001
Sending data...   value: 0000002
Sending data...   value: 0000003
Sending data...   value: 0000004
Sending data...   value: 0000005
<connext installation>/bin/rtiddsping -domainId 0 -subscriber
You’ll see the following output:
RTI Connext DDS Ping built with DDS version: 7.3.0
~~~~~~~~~~~~~~~~~~~~~~~~~~~~~~~~~~~~~~~~~~
rtiddsping is listening for data, press CTRL+C to stop it.
Found 1 additional ping publishers(s).
Current publisher tally is: 1
Found 1 additional alive ping publishers(s).
Current alive publisher tally is: 1
rtiddsping, issue received: 0000001
Detected Missed Sample(s) current: 1 cumulative: 1  (50.0)%
rtiddsping, issue received: 0000002
rtiddsping, issue received: 0000003
rtiddsping, issue received: 0000004
rtiddsping, issue received: 0000005
If you are running your publisher and subscriber applications on different
machines in a network without multicast support, you’ll need to specify the
other machine’s host name or IP address using the peer argument
(-peer <hostname|ip-address>).
<connext installation>/bin/rtiddsping -peer <addr> -domainId 0 -publisher -numSamples 10
<connext installation>/bin/rtiddsping -peer <addr> -domainId 0 -subscriber
The rtiddsping result should show the subscriber terminal receiving data. This result indicates the host and target machines are successfully communicating RTPS packets on domain 0.
If you had to use the -peer option, this result means that unicast
communication is successful, but multicast is not. To continue without
multicast, configure your applications to use these peers. For instructions,
see the “Without multicast support”
section in the Discovery module.
Communication failures noted by rtiddsping could indicate network issues. You may need to check your firewall configuration, opened/closed ports, and other network settings.
3. Check discovered applications with rtiddsspy#
When a subscriber does not receive data, but you know the target is reachable, you can use rtiddsspy utility to inspect the domain and determine:
which publisher and subscriber applications are running
the applications’ associated Topics and type definitions
the data being published
Run the publisher and subscriber if they’re not already running, and open
a new terminal window to run rtiddsspy with the domain argument (-domainId <#>).
<connext installation>/bin/rtiddsspy -domainId 0
You’ll see the following output:
RTI Connext DDS Spy built with DDS version: 7.3.0
~~~~~~~~~~~~~~~~~~~~~~~~~~~~~~~~~~~~~~~~~~
rtiddsspy is listening for data, press CTRL+C to stop it.

21:41:01 New writer        from 172.16.0.2      : topic="WindowStatus" type="DeviceStatus"
21:43:47 New data          from 172.16.0.2      : topic="WindowStatus" type="DeviceStatus"
21:43:49 Modified instance from 172.16.0.2      : topic="WindowStatus" type="DeviceStatus"
21:43:51 Modified instance from 172.16.0.2      : topic="WindowStatus" type="DeviceStatus"


---- Statistics ----
Discovered 1 DataWriters and 0 DataReaders
Received samples (Data, Dispose, NoWriters):
        3, 0, 0         (Topic="WindowStatus"  Type="DeviceStatus")
The output shows a writer but no readers. This result indicates the Subscriber application is not running on domain 0. (rtiddsspy prints the statistics at the end after you kill it.)
Recall that in step 1 you configured the Subscriber to use domain 1. Go back to the Subscriber application code and change the domain back to domain 0 as shown below.
Close the running subscriber instance, then update
home_automation_subscriber.py as follows:
participant = dds.DomainParticipant(domain_id=0)
Close the running subscriber instance, then update
home_automation_subscriber.cxx as follows:
dds::domain::DomainParticipant participant(0);
Run the subscriber application again. You’ll see the following output:
RTI Connext DDS Spy built with DDS version: 7.3.0
~~~~~~~~~~~~~~~~~~~~~~~~~~~~~~~~~~~~~~~~~~
rtiddsspy is listening for data, press CTRL+C to stop it.

21:46:18 New reader        from 172.16.0.2      : topic="WindowsStatus" type="DeviceStatus"
21:41:01 New writer        from 172.16.0.2      : topic="WindowStatus" type="DeviceStatus"
21:46:25 New data          from 172.16.0.2      : topic="WindowStatus" type="DeviceStatus"
21:46:27 Modified instance from 172.16.0.2      : topic="WindowStatus" type="DeviceStatus"
21:46:29 Modified instance from 172.16.0.2      : topic="WindowStatus" type="DeviceStatus"
21:46:31 Modified instance from 172.16.0.2      : topic="WindowStatus" type="DeviceStatus"


---- Statistics ----
Discovered 1 DataWriters and 1 DataReaders
Received samples (Data, Dispose, NoWriters):
        4, 0, 0         (Topic="WindowStatus"  Type="DeviceStatus")
The rtiddsspy terminal output now shows the reader. However, the subscriber still does not receive any data. Notice that rtiddsspy shows the Topic names, and they are slightly different. There’s a typo in the subscriber Topic name; so that’s the next fix to apply as shown below.
Close the running subscriber instance, then update
home_automation_subscriber.py as follows:
topic = dds.Topic(participant, "WindowStatus", DeviceStatus)
Close the running subscriber instance, then update
home_automation_subscriber.cxx as follows:
dds::topic::Topic<DeviceStatus> topic(participant, "WindowStatus");
Run the subscriber application again.
RTI Connext DDS Spy built with DDS version: 7.3.0
~~~~~~~~~~~~~~~~~~~~~~~~~~~~~~~~~~~~~~~~~~
rtiddsspy is listening for data, press CTRL+C to stop it.

21:51:07 New reader        from 172.16.0.2      : topic="WindowStatus" type="DeviceStatus"
21:41:01 New writer        from 172.16.0.2      : topic="WindowStatus" type="DeviceStatus"
21:51:11 New data          from 172.16.0.2      : topic="WindowStatus" type="DeviceStatus"
21:51:13 Modified instance from 172.16.0.2      : topic="WindowStatus" type="DeviceStatus"
21:51:15 Modified instance from 172.16.0.2      : topic="WindowStatus" type="DeviceStatus"
21:51:17 Modified instance from 172.16.0.2      : topic="WindowStatus" type="DeviceStatus"


---- Statistics ----
Discovered 1 DataWriters and 1 DataReaders
Received samples (Data, Dispose, NoWriters):
        4, 0, 0         (Topic="WindowStatus"  Type="DeviceStatus")
The domain ID and Topic name are now correct, and rtiddsspy is showing that samples are published, but our subscriber application is still not receiving any data. At this point, we need to look into the QoS the application is using.
4. Check health status with Admin Console#
Admin Console is a graphical tool to visualize Connext applications, including their health and data.
Launch Admin Console.
<connext installation>/bin/rtiadminconsole
In Admin Console, the DDS Logical View shows you the domain your applications are running in, the Topics in the domain, and the selected Topic’s health status.
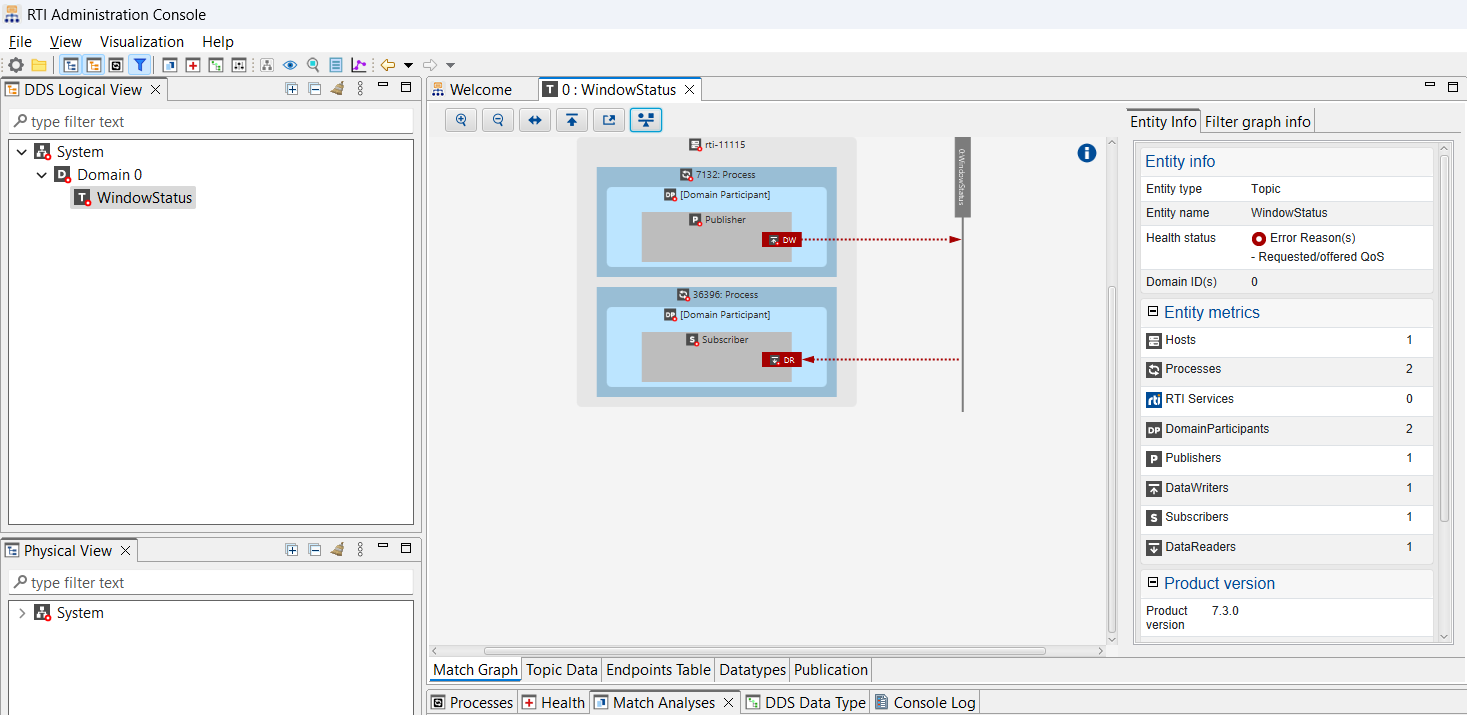
The DataWriter (DW) and DataReader (DR) display in red, indicating an issue. Click on either the DW or DR, then go to the Match Analyses tab.
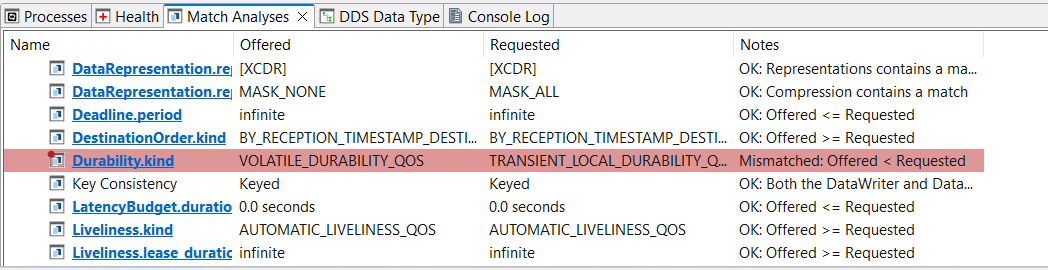
This tab indicates a mismatch in the durability QoS policy. The DataWriter offers a volatile durability, but the DataReader requests a stricter durability, transient local.
To fix this mismatch, change the durability QoS in your Subscriber application to use volatile durability.
Close the running subscriber instance, then update
home_automation_subscriber.py as follows:
reader_qos.durability = dds.Durability.volatile
Close the running subscriber instance, then update
home_automation_subscriber.cxx as follows:
reader_qos << dds::core::policy::Durability::Volatile();
Run the subscriber application again. In Admin Console, the DR and DW now appear green.
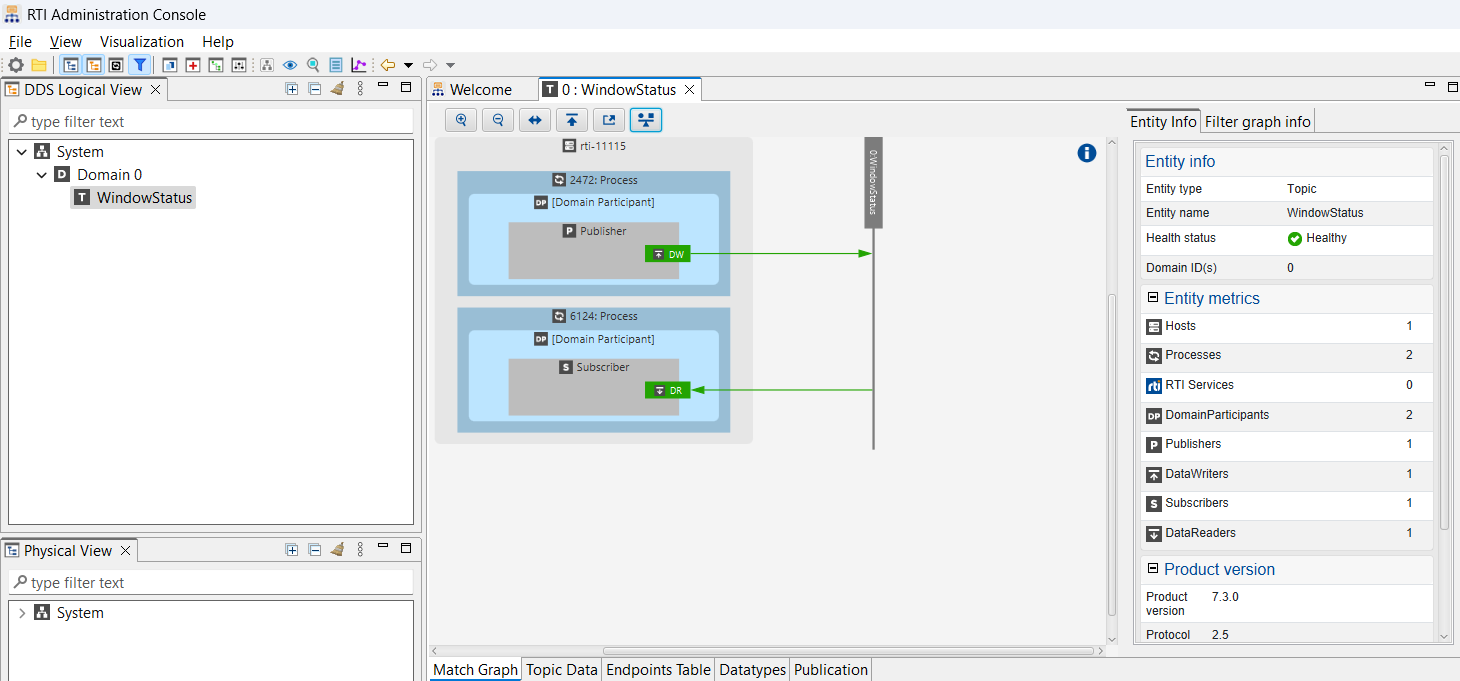
The subscriber application should now receive data.
Optional exercise#
Distributed logging (optional)
An additional way of visualizing and debugging errors in your system is with the use of Distributed Logger, a Connext library that publishes application logs as Topics. Admin Console can monitor these logs to determine the system’s health and can display them.
Follow this example in the Github repository to enable Distributed Logging, and then run Admin Console, click on System, and switch to the tab called “System log” to visualize the generated warning and error logs.
Learn More#
This module introduced rtiddsping, rtiddsspy, and Admin Console, three RTI tools to help you understand what applications are running and debug when they don’t communicate.
Next Steps
Related modules:
Data Visualization. Debugging your application has many starting paths, often starting with discovery. If discovery completes, visualizing your application can be the next step.
Observability. Beyond debugging, observability helps you understand how your distributed application is behaving in real-time.
Reference documentation:
Additional resources:
