Observability#
Introduction#
What you’ll learn
The RTI Observability Framework getting started guide will take you through the following steps:
Configure your Connext applications to forward telemetry data (logs and metrics)
Store the metrics in a Prometheus database
Store the logs in a Grafana Loki database
Visualize the data in Grafana dashboards
The following diagram provides an overview of the system you’ll build:
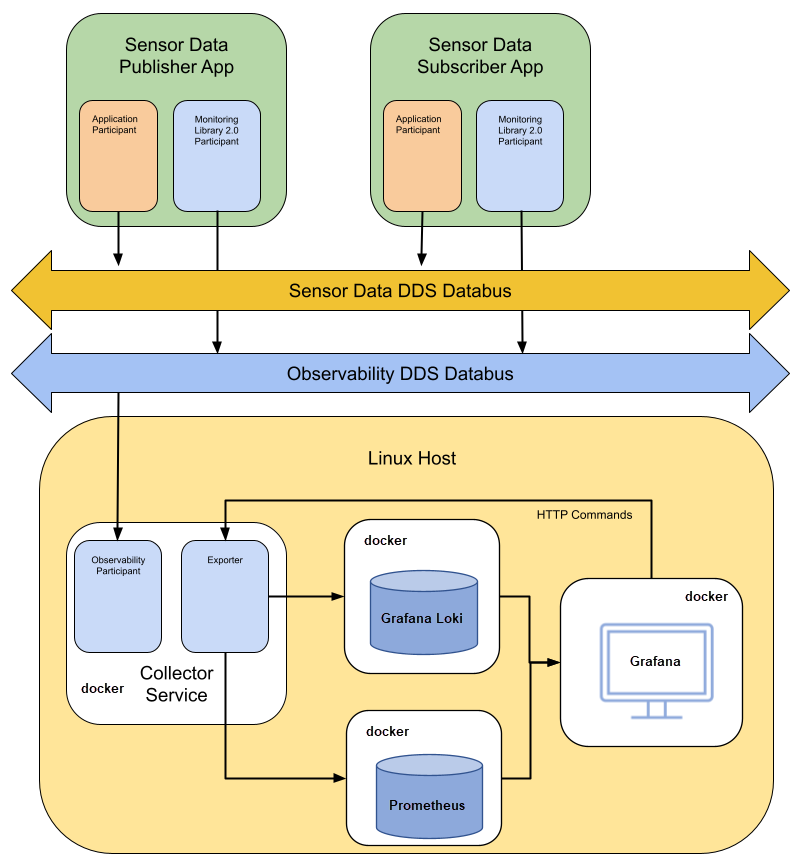
The user applications publish and subscribe to sensor data.
These applications are configured to forward telemetry data to the Collector Service
The Collector Service stores the metrics in a Prometheus database and the logs in a Grafana Loki database, which each run on a Docker container.
Another Docker container runs Grafana as the backend for the Grafana dashboards.
How to complete this module#
To complete this module follow the link to the RTI Observability Framework getting started guide .
Learn more#
Next Steps
Related modules:
Debugging. Use command line and graphical tools to debug why your applications don’t communicate.
Reference documentation:
