I am a ROS developer and have got used to a tool called rqt_graph: http://wiki.ros.org/rqt_graph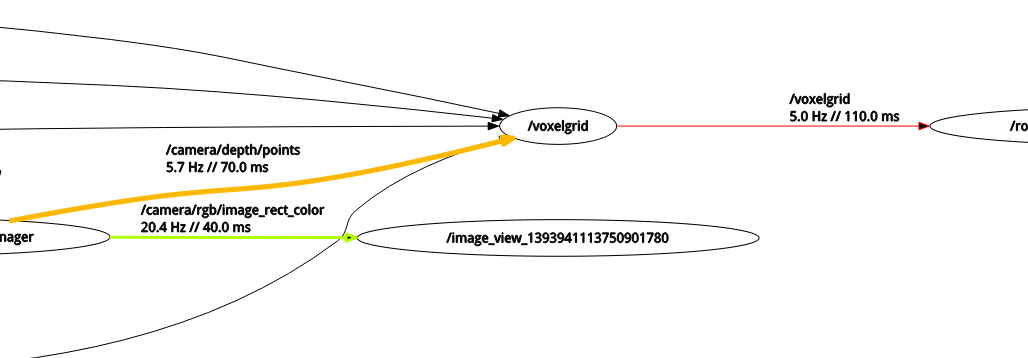
It shows the system data flow chart really well, i.e. which nodes are connected to which topics. Using an extra parameter you will get delay and frequency of the communication, so it is very useful.
I have tried looking into RTI admin console, but I am only able to visualize single topic at a time in the Match graph. also, I don't know where to find frequency / delay information.
The question is: does RTI have similar tools available, or how to best utilize admin console to see the whole system health at one once?

OK so it seems I need to create that one myself.
Hi,
Just to understand better your use case, did you take a look at the system view in Admin Console? For the overall performance, have you taken a look at the Monitoring libraries?
Also, using Routing Service enables some profiling as you were pointing out. Did you take a look? All in all, it's nothing like what you're showing, but the new version (coming soon) provides those profiles.
All the best,
Sara
Hi Tommi,
I apologize for the late response...I just now became aware of your post here.
You are right that we don't have a view similar to the one you posted and the fact that Admin Console only shows a single Topic at a time currently. Admin Console does not provide latency or throughput data for Topics. We do provide throughput information in the Monitor UI, however that does require that you load/link an instrumentation library (the monitoring library) in your application. That library also does not provide latency data. The features that Sara are mentioning are only for the Routing Service. But it does provide latency and throughput information for that service, yes.
We are looking into a modernization of our monitoring features. We've had requests similar to yours but I would like to further understand your thoughts/needs in this area so that when we start work on these features we can try to satisfy them. You could reply to this post or email directly if you prefer (ken at rti dot com).
Thanks,
Ken