Hello,
I am running RTI Connext 5.3.1 on a cluster of Beagle Black Bone (BBB) devices for a project. To benchmark the baseline maximum throughput for different data sample sizes, we used RTI DDS perftest 2.3.2. I had some questions about the observed performance results and I will be very grateful if you can help me in understanding the reason behind the observed results.
Test Setup: We are running perftest publisher on one BBB device and the perftest subscriber on another BBB device. For a given data sample size, the publisher sends data as fast as it can (we have not used either sleep or spin) to the subscriber for 5 minutes. Each test was repeated 3 times and the plotted results are the average values across these 3 runs. (Error bars denote std. dev.). This test was performed under both- default reliable QoS settings and bestEffort QoS settings (with -bestEffort commandline parameter).
Reliable Test Configuration:
Publisher command line parameters: ./perftest_cpp -pub -cpu -noPrintIntervals -nic eth0 -transport UDPv4 -dataLen <dataLength> -batchSize 0 -executionTime 300
Subscriber command line parameters: ./perftest_cpp -sub -cpu -noPrintIntervals -nic eth0 -transport UDPv4
Best Effort Test Configuration:
Publisher command line parameters: ./perftest_cpp -pub -cpu -noPrintIntervals -nic eth0 -transport UDPv4 -dataLen <dataLength> -batchSize 0 -executionTime 300 -bestEffort
Subscriber command line parameters: ./perftest_cpp -sub -cpu -noPrintIntervals -nic eth0 -transport UDPv4 -bestEffort
Questions about observed results:
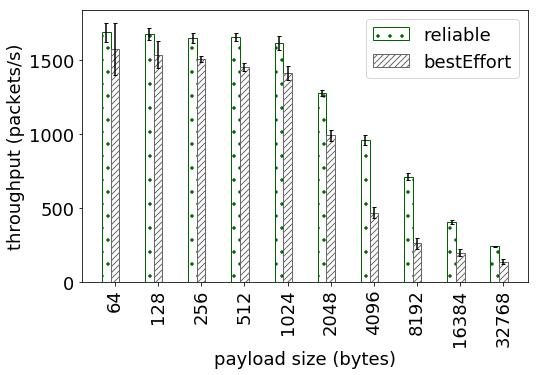
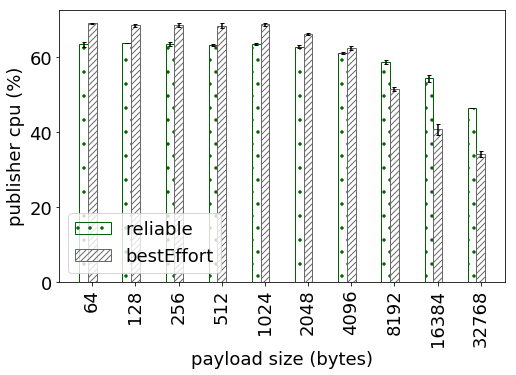
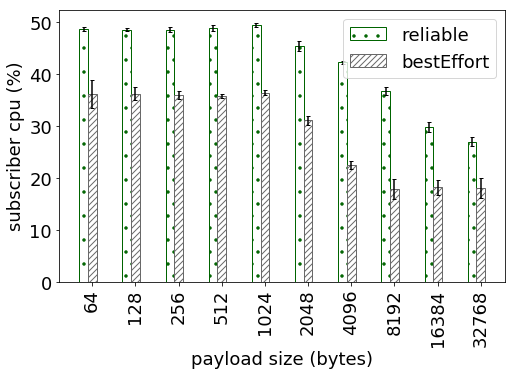
1. The perftest publisher is not using sleep/spin and is sending data as fast as it can. Yet, we are not able to saturate the CPU. The attached graph: cpu_pub.png shows the CPU utilization of perftest on publisher side and the graph: cpu_sub.png shows the CPU utilization on the subscriber side. I wanted to understand what is the bottleneck resource which is throttling the publisher and thereby limiting the maximum observed throughput (graph: throughput_pks). This behavior is observed even for the bestEffort configuration.
2. Why does the CPU utilization for both publisher and subscriber decrease with increasing dataLength sizes. I understand that the throughput in packets/second decreases as it takes longer to send larger messages which may impact the CPU utilization, but are there other reasons behind the observed trend.
Thank you for your time and help.
Shweta

