2.4.9.8. System View
System view provides general information about the DDS System, including a graphical representation of the DDS System, metrics about the discovered DDS Entitties, system log information and security log messages.
2.4.9.8.1. System Graphical View
The System Graphical View is the main view that is open when the System tab is opened. This view shows graphical information of the System, showing the Hosts and Processes that were detected through discovery in the System and how are those processes connected.
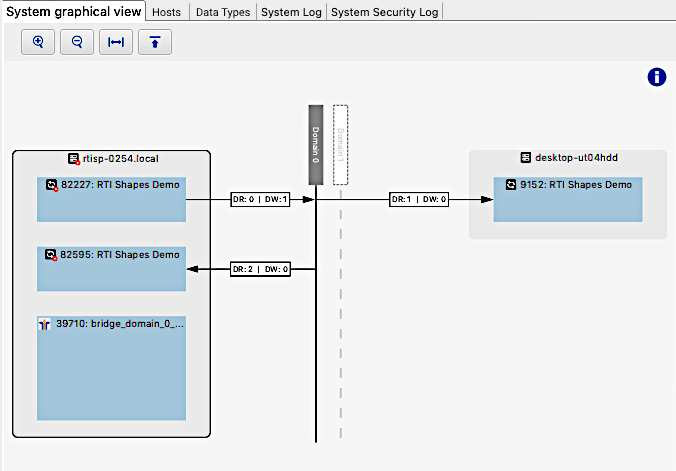
The System Graphical View is organized to show Hosts and Processes on both sides of the graph, connecting with the Domains, which are shown in the middle of the graph, connecting the Processes with the domains with edges that represents the DomainParticipants. Those edges will indicate, in the attached label, the amount of DataWriters and DataReaders that are created by that specific DomainParticipant.
For example, in the following image, the label indicates that the DomainParticipant, represented by that specific edge, created two DataReaders and one DataWriter.
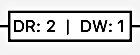
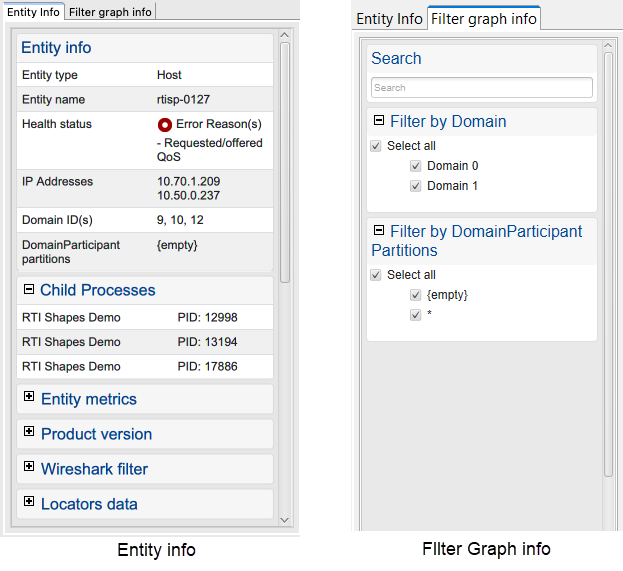
On the right side of the view, there’s a panel with specific options for the view. This panel includes:
Entity Info: This tab includes detailed information about the entities that are displayed in the graph and will be updated depending on which entity is selected or highlighted in the graph.
Filter graph info: This tab allows you to select which domains to show or hide in the graph view.
For example, the following images show detailed information for a Host in the system.
2.4.9.8.2. Hosts Tab
This table provides an overview of each host that is communicating with Admin Console.
Host - Name/IP of the hosts.
Health - Aggregate of the health value of all the services / processes recognized by Admin Console on this host.
Uptime - The time since the system has started until now.
CPU (%) - Current CPU usage of this host. This value is retrieved using “/proc/stat” on Linux systems and “GetSystemInfo” on Windows systems.
Free Memory - Current free memory available on this host. This value is retrieved using “sysinfo” on Linux systems and “GlobalMemoryStatusEx” on Windows systems.
Total Memory - Current memory usage of this host. This value is retrieved using “sysinfo” on Linux systems and “GlobalMemoryStatusEx” on Windows systems.
Free Swap Memory - Current free swap memory available on this host. This value is retrieved using “sysinfo” on Linux systems and “GlobalMemoryStatusEx” on Windows systems.
Total Swap Memory - Current swap memory usage of this host. This value is retrieved using “sysinfo” on Linux systems and “GlobalMemoryStatusEx” on Windows systems.
2.4.9.8.3. Data Types Tab
The Data Types table displays all data types in the distributed system that are active (have at least one associated DataWriter or DataReader). This table updates in real-time as system entities are created/destroyed. Each row represents a unique data type.
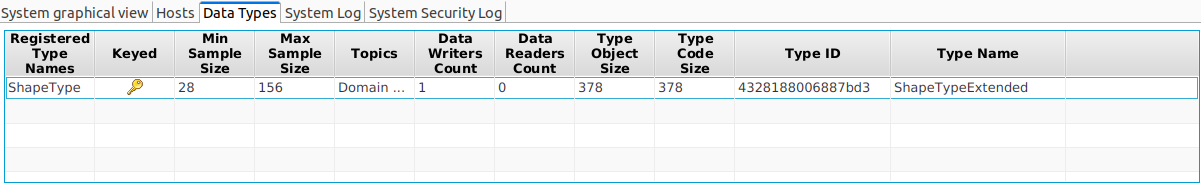
The columns are sortable; click a column header to change or reverse the sort order.
Registered Type Names - The set of unique names under which the data type has been registered.
Keyed - Indicates (through the presence of an icon) whether the data type contains a key.
Min Sample Size - The minimum size for samples of this type when serialized for distribution. Note that this size does not account for protocol overhead.
Max Sample Size - The maximum size for samples of this type when serialized for distribution. Note that this size does not account for protocol overhead.
Topics - The names of Topics associated with the data type. A maximum of eight (8) will be included, and then a count of the remaining Topics is added if needed.
DataWriters Count - The number of DataWriters associated with this data type.
DataReaders Count - The number of DataReaders associated with this data type.
Type Object Size - The serialized size of the TypeObject. Note that this is not the size for samples, explained above in the Min/Max Sample Sizes. This is the size needed to transfer information about the data type itself.
Type Code Size - The serialized size of the TypeCode. Note that this is not the size for samples, explained above in the Min/Max Sample Sizes. This is the size needed to transfer information about the data type itself.
Type ID - The unique identifier for the data type (if provided).
Type Name - The name of the data type. This name comes directly from the data type, not from the user-configurable registered type name.
2.4.9.8.4. System Log Tab
The System Log is a table that shows log messages (provided by Distributed Logger) aggregated from all of the processes in the entire distributed system.
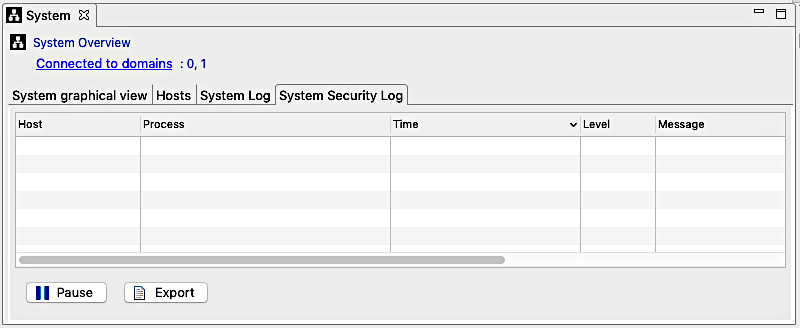
2.4.9.8.5. System Security Log Tab
The System Security Log is a table that shows security log messages (provided by Security Logger) aggregated from all of the processes in the entire distributed system.