2.1.2. System Visualization
2.1.2.1. Graphical Visualization
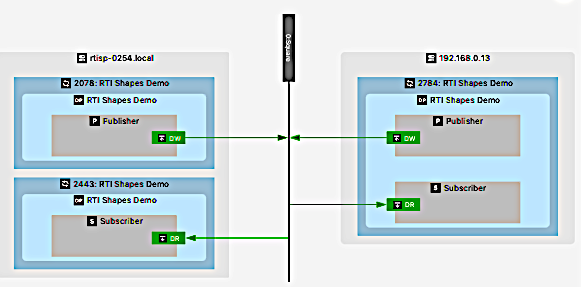
Admin Console’s visualization system displays your distributed system in an easy to understand graphical way. This will help you understand how your distributed system is configured. The Admin Console visualization view displays how elements are connected in the DDS System through different Domains and Topics.
The System graphical representation is common to different views in Admin Console’s User Interface. This representation shows the full system configuration, focusing the view on these aspects:
The different domains to which Admin Console is connected.
A Domain view that displays the different topics discovered in that Domain.
A Topic view, focused only on one specific Topic.
A Process view that shows relevant information for a specific process in your DDS system.
2.1.2.2. Graphical Components
The Graphical View is the main part of the graphical representation of your distributed system. This representation will show a set of different nodes connected according to your DDS System configuration.
2.1.2.2.1. Host
This node is the graphical presentation of one host or machine in the distributed system. To be represented in the graph, this host must contain at least one Process that is participating in the communication through DDS.
2.1.2.2.2. Process
This node shows an active process in the distributed system. To be represented in the graph, at least one DomainParticipant active in this process must have been discovered.
2.1.2.2.3. DomainParticipant
This represents one DomainParticipant that was discovered in the distributed system.
2.1.2.2.4. Publisher
This represents an active Publisher within an active DomainParticipant.

2.1.2.2.5. Subscriber
This represents an active Subscriber within an active DomainParticipant.
2.1.2.2.6. DataWriter
This represents one single DataWriter that is active in the distributed system.

2.1.2.2.7. DataReader
This represents one single DataReader that is active in the distributed system.

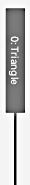
2.1.2.2.8. Connection Nodes
Connection nodes represent active Domains or Topics in the graph. Depending on the view, the connection nodes will show Domains or Topics, but both of them will never be shown in the same graph.
These nodes will always appear in the various available views that can be shown in the graph. The nodes that will be displayed in each kind of view are:
System View:
Connection nodes:
Domains
Other (non-connection) nodes:
Hosts
Processes
Edges represent DomainParticipants. Information in the edge label shows the number of DataWriters and DataReaders created by the DomainParticipant.
Domain View:
Connection nodes:
Topics
Other (non-connection) nodes:
Hosts
Processes
DomainParticipants
Edges represent the connection between the DomainParticipant and the different topics shown on the graph. Information in the edge label indicates how many DataWriters and DataReaders were created by that DomainParticipant, in order to communicate with the Topic to which it connects.
Topic View:
Connection nodes:
Topic: Only one connection is available in this graph
Other (non-connection) nodes:
Hosts
Processes
DomainParticipants
Publishers
Subscribers
DataWriters
DataReaders
Edges represent the connection between the DataReaders and Datawriters with the Topic.
Process View:
Connection nodes:
Topics: This view can show all the topics that the Process is connected to.
Other (non-connection) nodes:
Hosts
Processes
DomainParticipants
Publishers
Subscribers
DataWriters
DataReaders
Edges represent the connection between the DataReaders and Datawriters with the Topic.
2.1.2.3. Graph Toolbar
On top of the graph, there is a graph toolbar that you can use for the first basic interaction with the graph. From this toolbar you can perform actions like zooming in and out, adjusting the width of the view to fit the graph, moving the view to the top and, if possible, balancing the graph load on both sides of the connection node, to make it easier to see the distributed system.
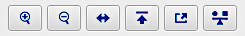
The buttons on this toolbar perform these actions:
Icon |
Meaning |
Description |
|
Zoom in |
Adjust the graph view to zoom in |
|
Zoom out |
Adjust the graph view to zoom out |
|
Move view to top |
Move the graph view to the top of the graph |
|
Fit graph width |
Adjust the graph view to fit the width of the current graph |
|
Export graph to image |
Export the current graph to an image file |
|
Balance the graph |
Perform a graph balancing, which adjusts the number of nodes on the left and right sides |


2.1.2.4. Entity Info
The Entity Info section is on the right side of the System visualization panel. This section displays information about a selected or highlighted Entity.
The Entity Info section is completely adaptative and will change based on the interaction performed with the graph. If no entity is selected or highlighted, this section will show information about the Entity that is represented in the graph. Otherwise, the information will be updated to include information about the selected or highlighted Entity.
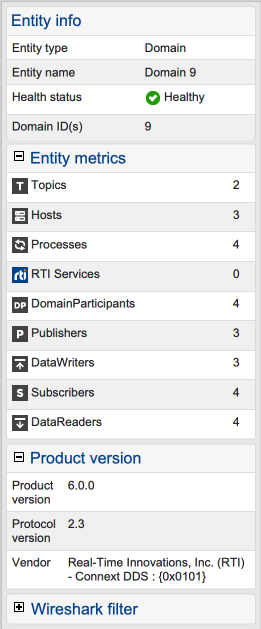
The information available in this section contains fields adapted to the kind of entity of interest. The fields that may appear, based on the entity, include:
Entity info: General information about the entity for which information is being displayed. This includes information such as the type of entity, name, health status, connected domains, process ID, GUID, connected topics, etc.
Entity metrics: Metrics for the specific entity, such as how many topics or domains it is connected to, or the number of created child entities.
Product version: The product version, protocol version, and vendor of the DDS Entity.
Host Information: Information about the host where the entity is running.
Wireshark filters: Filters for use with Wireshark, to filter the data for only the specific entity.
Locators data: Information about the locators available for the specific entity.
Child processes: Specific information for the Hosts, and generic information about the child processes created by the Host.
Not all the information described above will be available for all entities. Only relevant information will be shown, depending on the type of selected entity.
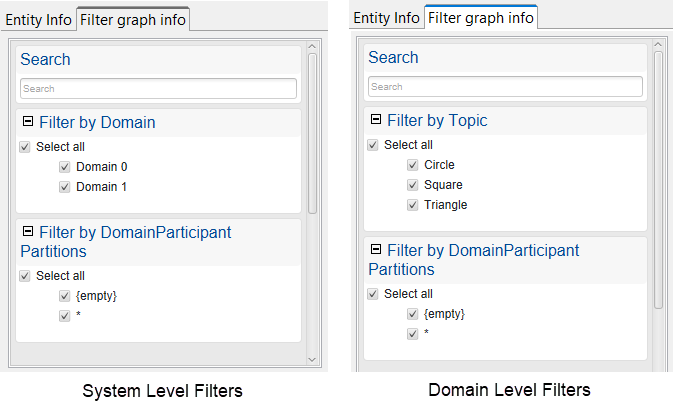
2.1.2.5. Filter Graph Info
The Filter graph info tab enables you to select which Domains, Topics, or DomainParticipant partitions display in the Graphical View. The DomainParticipant partitions filter is available at all levels. In addition:
At the system level, you can also select which domains to display.
At the domain level, you can also select which Topics to display.
2.1.2.6. Graph Interaction
You can interact with the graph to navigate through the different views and analyze your distributed system. Then you can update the Match Analysis to focus on a specific entity, select an entity to lock the Match Analysis and update the rest of Admin Console User Interface widgets, then navigate (if possible) to a view that shows information about one specific entity in the graph. Here’s how:
Move your mouse over one element:
When no entity is selected, you can move the mouse on top of one node in the graph. This updates the Match Analysis and the Entity Info tab. To do this, you only need to leave the mouse on top of a specific node for half a second and the node will be highlighted.
Select one element:
When you click on a specific element in the graph, that element is selected and the match analysis will be done for that specific node. When this happens, the highlighting functionality stops updating the match analysis and the Entity Info tab is blocked with the information about the selected entity. The other Admin Console panels are updated with all the information about the selected entity.
Double-click:
Double-click to navigate to the specific view for the selected entity (if that entity has a specific view). For example, double-clicking on a Topic node will open the Topic View.