2.2.2. Step 2: Distributed System at a Glance
In this step, you will see how Admin Console provides insights about your distributed system in one central view. We will walk through the content of various panels.
2.2.2.1. Physical and DDS Logical Trees
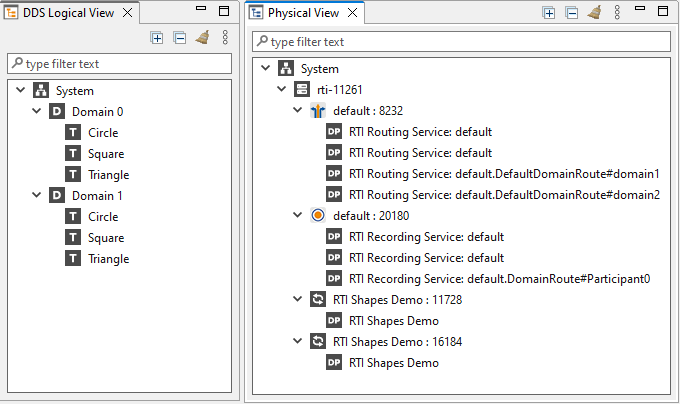
The System tree offers a hierarchical view of your distributed system.
Expand the root System node and the node with the name of your host to
see the list of running services. If there are warnings or errors
associated with an entity, you will see the warning  or error
  icon attached to the entity’s icon.
If you click on a node, a new tab with details about that entity opens in the main view. The first time you click a DomainParticipant in the Physical View, information for its parent process displays in the main view. If selected a second time, the QoS and other panels display data from that DomainParticipant.
2.2.2.2. System Overview
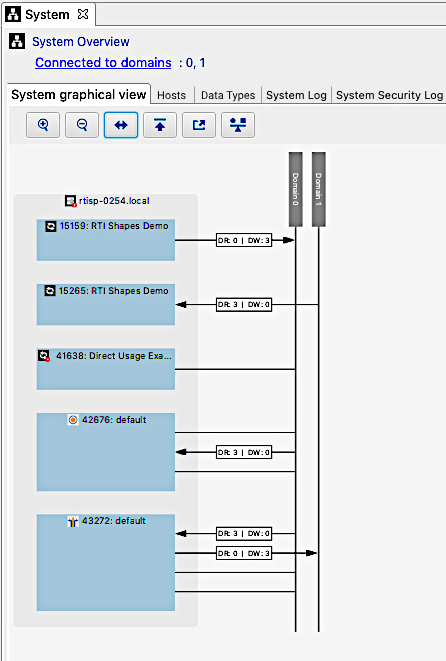
Note
The entity counts in the screenshot are not reflective of those from this tutorial.
Click on the root node named “System” to open the System details page. You will see a few summary views:
The list of domains you are currently connected to. Clicking on “Connected to domains” will bring you to the preferences page, where you can decide how you want Admin Console to manage domains (automatically or manually).
A System Graphical View that represents all the entities that were discovered by Admin Console. The different entities are represented with nodes (hosts, processes, domains, etc.).
An Entity Info panel with a summary of the whole system if nothing is selected in the graphical view, or specific information about the selected entity in the System Graphical View.
2.2.2.3. Processes Table
The Processes table provides a summary view of all the running processes and RTI services. To access it, go to View > Processes View.
In the Processes table, locate the Distributed Logger Example that was started in Step 1: System Setup, then select it in the Process column.
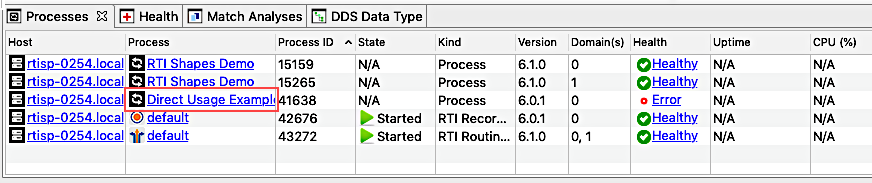
In the main view, select the Log tab to see the log messages generated by this process.
See Step 6: Distributed Log View for details on the options for viewing the distributed Log.
Relevant reference topics: